Home > Newsletter Archives
Looking at the Bacteria Inside: New Method of Viewing TB Bacteria
Although TB is commonly thought of as being a disease that mainly affects 19th century poets and Victor Hugo characters, it is still the second-most common cause of mortality from an infectious disease in the world, killing nearly 3 people every minute.
Although tuberculosis (TB) is commonly thought of as being a disease that mainly affects nineteenth century poets and Victor Hugo characters, it is still the second-most common cause of mortality from an infectious disease in the world, killing nearly three people every minute. Every March 24, on World TB Day, the global health community recognizes the work of Robert Koch, who announced on that date in 1882 his discovery of Mycobacterium tuberculosis, the bacteria that causes TB.
TB is generally a curable disease -- but first it must be diagnosed, and that has been one of the biggest barriers in its elimination. M. tuberculosis grows very slowly, so traditional methods of diagnostic testing take a very long time. A team from the Texas A&M Health Science Center College of Medicine has been working on a new approach. The work is led by Jeffrey Cirillo, Ph.D., a professor in the Department of Microbial Pathogenesis and Immunology.
Cirillo's previous research, which has been supported by the Bill and Melinda Gates Foundation and the Wellcome Trust, has focused on developing a rapid yet inexpensive test for tuberculosis. He and his team have nearly perfected the technology and are in the process of bringing the test to market.
The slow growth of M. tuberculosis also makes development of new therapeutics difficult because it takes so long to determine if the treatment is working.
Now, Cirillo and his team have developed a method of detecting whether a potential treatment is working as early as a day after it is given. "Since M. tuberculosis takes about a month to quantify using traditional approaches, any method that allows direct determination of the amount of bacteria present is very valuable and speeds progress, saving months every time an experiment is done," Cirillo said. "Our methods allow this."
Using optical imaging technology, the researchers can observe the bacteria in real time, in living animals, without harming them. This way, it is easy to determine if a proposed treatment is working and the number of bacteria is decreasing.
"There have never been sensitive enough systems to measure the bacteria directly in animals," Cirillo said. "This is a completely new technology and has nearly limitless applications to microbiological research, particularly in animals, but it increases sensitivity in any experimental system."
Drug-resistant TB, now present everywhere in the world, is hampering efforts to fight the disease because the usual drugs used to treat it are no longer effective. Therefore, new, more effective treatments need to be developed.
The researchers first had to find the best fluorescent protein to help them visualize the bacteria.
"We use very sensitive systems that can actually see the signal through mammalian tissue," Cirillo said. "This works best in the near-infrared, which is where our signals are primarily produced."
Active TB causes symptoms such as cough, fever, night sweats, weight loss. If left untreated -- a common scenario in developing countries lacking health care infrastructure -- a person with active TB has only a 50 percent chance of survival, and he or she will infect an average of 10 to 15 people each year.
"The goal in TB research is complete eradication of the disease," Cirillo said. "We think this new technology is one tool to do just that."
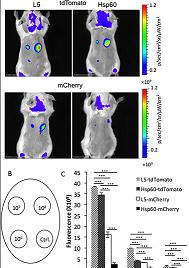
Illustration: A. Images of subcutaneous infected mice with M. bovis BCG strains expressing L5-tdTomato, Hsp60-tdTomato, L5-mCherry, or Hsp60-mCherry. 108, 107, and 106 CFU of bacteria were injected subcutaneously into BALB/c mice. Images were acquired by epi-illumination at day 1 post infection. B. The locations of the injections were shown on the map. C. Quantitative analysis of the images. Four mice were infected with technical replicates of the same culture. Values in the Y-axis represent mean of fluorescence for each dose of bacteria. The error bars are standard deviations. Data represent one of two independent replicate experiments. One-way ANOVA test was conducted for assessing overall differences among groups, and Turkeys multiple comparison tests were applied to assess differences between two groups. * P<0.05; ** P<0.01; and *** P<0.001. Ying Kong, et al. PLOS ONE.
Read more...
Newswise (03/24/16)
Science Daily (03/25/16)
Abstract (PLOS ONE; 2016, 11 (3): e0149972.)
TB is generally a curable disease -- but first it must be diagnosed, and that has been one of the biggest barriers in its elimination. M. tuberculosis grows very slowly, so traditional methods of diagnostic testing take a very long time. A team from the Texas A&M Health Science Center College of Medicine has been working on a new approach. The work is led by Jeffrey Cirillo, Ph.D., a professor in the Department of Microbial Pathogenesis and Immunology.
Cirillo's previous research, which has been supported by the Bill and Melinda Gates Foundation and the Wellcome Trust, has focused on developing a rapid yet inexpensive test for tuberculosis. He and his team have nearly perfected the technology and are in the process of bringing the test to market.
The slow growth of M. tuberculosis also makes development of new therapeutics difficult because it takes so long to determine if the treatment is working.
Now, Cirillo and his team have developed a method of detecting whether a potential treatment is working as early as a day after it is given. "Since M. tuberculosis takes about a month to quantify using traditional approaches, any method that allows direct determination of the amount of bacteria present is very valuable and speeds progress, saving months every time an experiment is done," Cirillo said. "Our methods allow this."
Using optical imaging technology, the researchers can observe the bacteria in real time, in living animals, without harming them. This way, it is easy to determine if a proposed treatment is working and the number of bacteria is decreasing.
"There have never been sensitive enough systems to measure the bacteria directly in animals," Cirillo said. "This is a completely new technology and has nearly limitless applications to microbiological research, particularly in animals, but it increases sensitivity in any experimental system."
Drug-resistant TB, now present everywhere in the world, is hampering efforts to fight the disease because the usual drugs used to treat it are no longer effective. Therefore, new, more effective treatments need to be developed.
The researchers first had to find the best fluorescent protein to help them visualize the bacteria.
"We use very sensitive systems that can actually see the signal through mammalian tissue," Cirillo said. "This works best in the near-infrared, which is where our signals are primarily produced."
Active TB causes symptoms such as cough, fever, night sweats, weight loss. If left untreated -- a common scenario in developing countries lacking health care infrastructure -- a person with active TB has only a 50 percent chance of survival, and he or she will infect an average of 10 to 15 people each year.
"The goal in TB research is complete eradication of the disease," Cirillo said. "We think this new technology is one tool to do just that."
Illustration: A. Images of subcutaneous infected mice with M. bovis BCG strains expressing L5-tdTomato, Hsp60-tdTomato, L5-mCherry, or Hsp60-mCherry. 108, 107, and 106 CFU of bacteria were injected subcutaneously into BALB/c mice. Images were acquired by epi-illumination at day 1 post infection. B. The locations of the injections were shown on the map. C. Quantitative analysis of the images. Four mice were infected with technical replicates of the same culture. Values in the Y-axis represent mean of fluorescence for each dose of bacteria. The error bars are standard deviations. Data represent one of two independent replicate experiments. One-way ANOVA test was conducted for assessing overall differences among groups, and Turkeys multiple comparison tests were applied to assess differences between two groups. * P<0.05; ** P<0.01; and *** P<0.001. Ying Kong, et al. PLOS ONE.
Read more...
Newswise (03/24/16)
Science Daily (03/25/16)
Abstract (PLOS ONE; 2016, 11 (3): e0149972.)
Newsletter Archives
U.S. News
World News
Regenerative Medicine Journal
Point Of View
U.S. News
Hydrogels Pave Way for Future of Soft Robotics Improving Motor Recovery in People with Chronic Post-Stroke Hemiparesis Working to Restore a Healthy Microbiome New Animal Model to Study Human T Cell-Mediated Immunity Abbott's Heartmate 3 Heart Pump Extends Life Beyond 5 Years for Advanced Heart Failure Patients Antisepsis Agents Interchangeable in Reducing Infection Risk in Open Fracture Surgeries Simple, Rapid and Robust Method Makes Mouse Whole Organs Transparent for Imaging Turning the Spotlight on Cells in Tissues so RNA Can Tell Their Story World's First Stem Cell Treatment for Spina Bifida Delivered During Fetal Surgery Cancer: Dual-Targeting CAR NK Cells Can Prevent Cell Dysfunction and Tumor Escape New Study Allows Scientists to Test Therapeutics for Rare Disease Affecting Young Children Researchers Identify Potential Therapeutic Targets to Prevent Hearing Loss Caused by Antibiotics This Molecule Could Be Behind Liver Fibrosis Potential of Precision Genome Editing in Treating Inherited Retinal Diseases RNA-Editing Tool a Fast, Sensitive Test for COVID-19 In-Home Wireless Device Tracks Disease Progression in Parkinson's Patients Shape-Shifting Fat Cells Fuel Breast Cancer Growth Discovery Could Power Up Platelet Production to Battle Blood Shortages Researchers Develop Messenger RNA Therapy for Ovarian Cancer, Muscle Wasting Blocking an Ion Channel Improves Muscle Function and Survival in Mice with Severe Duchenne Muscular Dystrophy Muscle Models Mimic Diabetes, Inform Personalized Medicine New Checkpoint Gene Demonstrates Ability to Supercharge Immune Cells Against Cancer Akouos Receives FDA Clearance of its IND Application for AK-OTOF, a Gene Therapy Intended for the Treatment of OTOF-mediated Hearing Loss Nanoscope Therapeutics Announces Completion of Enrollment in STARLIGHT Phase 2 Clinical Trial of MCO-010 Optogenetic Gene Therapy for Stargardt Disease New Advances in Stem-Cell Derived Mouse Embryo Model Stem Cell-Gene Therapy Shows Promise in ALS Safety Trial Developing a Novel Extracorporeal Hemoadsorption Device A Smart Pill Hoping to Halt Post-Traumatic Osteoarthritis Advancing Circuit Manipulation Capabilities in the Brain Laying the Groundwork for the Treatment of Temporomandibular Disorders Growing New Organs in a Person for the First Time Popular Mechanics Features Human Sight-Restoring Technologies Review of Microfluidic Tools Shows Flow of Innovation Addressing Chronic Rejection in Heart Transplants Grant Boosts Respiratory Support for Lung Disease Patients 3D Printing Ice First Patient Enrolled in a Phase II Clinical Trial of CardiolRx(TM) for Treatment of Acute Myocarditis Company Launches with $55 Million Seed to Reprogram Biology by Writing and Delivering Big DNA Protein Homeostasis in a Frontotemporal Dementia Mother's Milk Cells Key to Novel Infant Disease Therapy New Study Highlights Differences in Neuropathic Pain Relief for Men and Women Dr. Kurt Weiss and Pittsburgh Cure Sarcoma Developing Next-Generation AAV Gene Therapy Vectors for Ocular Diseases Model (Virus) Behavior Dr. Jonathan Cheetham: Touching a Nerve Carnegie Mellon Exosome Engineering Tech Licensed to Coya Therapeutics Concussion Incidence Increases the Risk of a Suicide Attempt in Some Children with a History of Depression Pittsburgh Craniofacial Sciences Training Program (PCSTP) Experts Study Marine Mammals to Learn About Human Hearing Self-Assembled, Interlocked Threads: Spinning Yarn with No Machine Needed Pitts RNEL and Blackrock Neurotech to Expand Reach of Brain-Computer Interface Trials with In-Home System Building a Better Blood Bankin Kenya The University of Pittsburgh Will Compete for $10 Billion in Military Health Contracts Ketogenic Diet Helps Mouse Muscle Stem Cells Survive Stress Small Package, Big Potential to Help Cell-Based Therapies Recruiting Patients Clinical Trial Volumetric Muscle Loss Transplantation Science and the Department of Defense: A Unique Partnership CMMR AI/ML Symposium and Healthcare Lessons from the Military LivaNova PLC Acquires ALung Technologies, Inc. New Coronavirus Variant of Concern Detected in Western Pennsylvania Dr. John Kellum and Colleagues Push for Prognostic Test to End Silent Epidemic Dancing in the Light Heady Math Could Resolve a Breathy Conundrum Collaborators Receive $250,000 SBIR Grant in Support of Transplants for Kids Project Discovery of Cell-Based Chemical Probes Targeting Aberrant Angiogenesis in the Eye It Takes a Heart to Make a Better Lung Machine Learning Model Can Steer Traumatic Brain Injury Patients to Life-Saving Care Endovascular Orifice Detection Device for In Situ Fenestration of AAA New Insights About Bad News Breast Cancer Mutation Point to Treatment Opportunities Illumination of Immune Checkpoint LAG3 Black Box Could Yield New Cancer and Autoimmune Therapies Hepato-Healing: A Treatment from Within Cardiomyopathy Leads to Heart Transplantation for Sharpsville Man Podcast: A History of Mechanical Circulatory Support of the Heart with Dr. Harvey Borovetz Collaboration Shapes Extracellular Vesicle Retention Strategy Sensing Signals in Paralyzed Muscles New Hope for Predicting and Treating Heart Failure in Babies Born with Deadly Heart Defect Podcast: DARPA Mini-Manhattan Project for Wound Healing with Dr. Stephen Badylak Upcoming Stentrode Trial in Pittsburgh to Help Patients with Quadriparesis Bone Super Glue Travels to Space R01 Grant Received for Research of Cholestatic Liver Diseases Podcast: In-Space Production of Biomanufacturing with Ms. Christine Kretz and Dr. William Wagner Treatment Correcting Night Blindness in Dogs Offers Hope for Treating Similar Condition in People Podcast: Cellular and Molecular Engineering in Orthopaedic Research with Dr. Peter Alexander Podcast: Identifying Effective Biomarkers of Disease in Transplantation with Dr. Hēth Turnquist Potential Window for Treating ALS Identified Cells Dancing Harmonic Duets Could Enable Personalized Cancer Therapies New Technology Could Make Biopsies a Thing of the Past New Test Predicts Sepsis Before Blood Clots Cause Permanent Organ Damage, Markedly Increasing Survival Deleting a Protein Might Reduce Cardiovascular Disease In Pre-Clinical Study, Implant Churns Out CAR-T Cells to Combat Cancer Human Induced Pluripotent Stem Cells Improve Visual Acuity, Vascular Health Fundamental Cancer Metabolism Dogma Revisited New Tool to Accelerate Drug Discovery Leveraging AI to Work with Cells Chronologically Young, Biologically Old: DNA Linked to Cancer Survivors Premature Aging Quantum Dots Shine Bright to Help Scientists See Inflammatory Cells in Fat Computational Approach Enables Spatial Mapping of Single-Cell Data Within Tissues Could Diet Modification Make Chemotherapy Drugs More Effective for Patients with Pancreatic Cancer? Dr. David Kaczorowski on Xenotransplantation Newly Issued Patents for McGowan Institute Affiliated Faculty Members Permeability of the Blood-Brain Barrier in Mice The Immune System Is Very Complicated, But Now, It's on a Chip A New Brain-Computer Interface with a Flexible Backing Scientists Make Leap Forward for Genetic Sequencing Cellular Therapy Improves Signs and Symptoms of Duchenne Muscular Dystrophy Scientists Identify Possible New Treatment for COVID-19 Dr. Dan Ding: New Tech Making Fitness More Accessible to People of All Abilities Investigating the Effects of Critical Illness in Early Childhood on Neurocognitive Outcomes Single Protein Prompts Mature Brain Cells to Regenerate Multiple Cell Types Study of Rare Disease Reveals Insights on Immune System Response Process Digital Toolbox May Help Diagnose Dementia Earlier Promising Approach Against Treatment-Resistant Cancer Cellular Rejuvenation Therapy Safely Reverses Signs of Aging in Mice Newly Issued Patents for McGowan Institute Affiliated Faculty Members Advancing Our View at the Subcellular Level Plant Product Shows Promise in Mouse Model of Parkinsons Disease How Some Gut Microbes Awaken 'Zombie' Viruses in Their Neighbors Key Regulator of Cell Differentiation Identified Unequal Communication Between Two Neurons More Common Than Previously Thought Study Points to Missing Link Between Age-Related Fat Loss and Diseases of Aging The Relationship Between Blood-Based Bioenergetics and Muscle Function, Mobility, and Aging First-of-Its-Kind Live Imaging Leads to Major Discovery in How Cells Pattern in Tissues Newly Developed Radio-Labeled Molecule Enables Real-Time Imaging of Innate Immune Activity Researchers Create Personalized Organoid Models for Rare Spinal Cancer When a Protective Gene Buffers a Bad One, a Heart Can Beat Youbiotics Receives Commercialization Grant from Pitt Chancellors Gap Fund Can AI Help Unravel the Mysteries of Sepsis and Save Lives? Agreement to Bioengineer Innovative Approaches to Organ Transplantation Cell Groups Push, Rather Than Pull, Themselves into Place as Organs Form and Cancers Spread A Microbial Compound in the Gut Leads to Anxious Behaviors in Mice New Drug Combination Effective for Patients with Advanced Ovarian Cancer Biohybrid Fish Made from Human Cardiac Cells Swims Like the Heart Beats The Shift to Using Fewer Opioids Calming the Cytokine Storm New Computational Tool Predicts Cell Fates and Genetic Perturbations Characterizing the Progression of Atherosclerotic Plaques and Predicting Rupture Vulnerability Mechanical Hearts Can Regenerate Some Heart Tissue Genetic Remodeling in Tumor Formation In Mice, Mothers with Metabolic Syndrome Can 'Turn On' Offsprings Liver Disease Poor Sleep Can Triple Risk for Heart Disease Researchers Discover Repair Properties of a Protein Critical for Wound-Healing in Gut Diseases Can a Dangerous Microbe Offer a New Way to Silence Pain? Possible Stroke Therapy Advances with Development of a Cell Tracking Tool Researchers Discover New Way to Target Secondary Breast Cancer that Has Spread to the Brain Key Growth Factor Protects Gut from Inflammatory Bowel Disease Making RNA Vaccines Easier to Swallow Researchers Identify Proteins that Could Predict Liver Transplant Rejection Scientists Regrow Frog's Lost Leg Researchers Discover Cause, Develop Pharmacological Treatment for Reducing Retinitis Pigmentosa Vision Loss Mechanical Basis for Abdominal Aortic Aneurysm New Peer-Reviewed Publication Expanding Liver Regeneration Technology Dr. David Kaczorowski Member of Surgical Team on Historic First Successful Transplant of Porcine Heart into Adult Human with End-Stage Heart Disease Podcast: Regenerative Rehabilitation and Future Potential Therapeutics with Dr. Fabrisia Ambrosio Podcast: ECM and Tissue Reconstruction with Dr. George Hussey Researchers Identify Immunological Markers for SARS-Cov-2 Reinfection Current Vaccines Teach T Cells to Fight Omicron Antibody with Engineered Peptide Targets Bone Metastasis Fast, Cheap Test Can Detect COVID-19 Virus Genome Without Need for PCR Nano Bubbles Could Treat, Prevent Current and Future Strains of SARS-Cov-2 Newly Discovered DNA Repair Mechanisms Point to Potential Therapy Targets for Cancer and Neurodegenerative Diseases Artificial Intelligence Identifies Individuals at Risk for Heart Disease Complications Measuring Tiny Eye Movements Can Help Identify Vision Impairments After Concussions Nanotherapy Offers New Hope for the Treatment of Type 1 Diabetes Origin of Rare Disease FOP Rooted in Muscle Regeneration Dysfunction Novel Treatment Target for Heart Disease Found in the Blood Vessel Wall The First AI Breast Cancer Sleuth That Shows Its Work Mathematical Model May Help Improve Treatments and Clinical Trials of Patients with COVID-19 and Other Illnesses Nuclei-Free Cells Prove Utility in Delivering Therapeutics to Diseased Tissues Epstein-Barr Virus May Be Leading Cause of Multiple Sclerosis BPA Exposure of the Placenta Could Affect Fetal Brain Development Exercise Alters Brain Chemistry to Protect Aging Synapses Precision Rehabilitation to Prevent Osteoarthritis Scientists Retool CAR T Cells to Serve as Micropharmacies for Cancer Drugs Researchers Develop Structural Blueprint of Nanoparticles to Target WBCs Responsible for Acute Lung Inflammation New Study Adds More Evidence for Omicron Immune Evasion Neuroprotective Mechanism Altered by Alzheimer's Disease Risk Genes Pop-Up Electronic Sensors Could Detect When Individual Heart Cells Misbehave Flexibility May Be the Key to Potent Peptides for Treating Diabetes Promising New Target for Tuberculosis Treatment Leveraging Space to Advance Stem Cell Science and Medicine Traumatic Injury Response Characterized for First Time on Cellular Level Mapping the Cell Specific DNA Damage-Induced Molecular and Bioelectrical Responses in the 3D Cardiac Unit Conducting a Preclinical Assessment of a Compliance Matched Biopolymer Vascular Graft Blood from Marathoner Mice Boosts Brain Function in Their Couch-Potato Counterparts Humble Lizards Offer Surprising Approach to Engineering Artificial Lungs CBD Reduces Glioblastomas Size, Supportive Environment in Experimental Model Disarming a Blood-Clotting Protein Prevents Gum Disease in Mice How Tissues Form Complex Shapes That Enable Organ Function Estimating the Strength of Selection for New COVID-19 Variants SARS-CoV-2 Goes 'Underground' to Spread from Cell to Cell Microorganism Sheds New Light on Cancer Resistance Study Identifies Factor in Young Blood That Helps Rejuvenate Aged Mouse Muscle Dr. William Wagner Points to Bright Future for Regenerative Medicine Pitt Researchers Identify Molecular Underpinnings of Liver Disease in Patients with Cystic Fibrosis When Demand Outstrips Capacity, Injections of COVID-19 Treatment Instead of IV Are Justified Uncovering a Promising Use Case for Exosomes New Game to Help Reduce Vaccine Hesitancy for Teens, Children Chemoimmunotherapy Dramatically Improved Survival of High-Risk Neuroblastoma Patients Cataract Surgery Linked with Lessened Dementia Risk Immune System-Stimulating Nanoparticle Could Lead to More Powerful Vaccines Precise New Form of Brain Surgery Requires No Incisions, Scalpels Intracerebral Cell Therapy and the Impact of Physical Therapy Pitt Researchers Receive Grant to Explore Wireless Technology for Those with Disabilities Researchers Shrink Camera to the Size of a Salt Grain We Might Not Know Half of Whats in Our Cells, New AI Technique Reveals Optoelectrode Changes Reduce Injuries to Brain Tissue, Improve Nerve Research Ultrashort-Pulse Lasers Kill Bacterial Superbugs, Spores SARS-Cov-2 Infection Hijacks Key Cellular Process, Autophagy Researchers Discover Deleting Dysfunctional Cells Alleviates Diabetes Repurposed ALS Drug Shows Promise in Mouse Model of Rare Childhood Genetic Disorder A Stealthy Way to Combat Tumors LyGenesis Adds Inborn Errors of Metabolism, Orphan Pediatric Indications with Large Unmet Needs, to its Drug Development Pipeline COVID-19 Case Severity: How Genetic Differences Leave Immune Cells at a Disadvantage New Imaging Technology May Reduce Need for Skin Biopsies New Cell Discovered and Shown to Regulate Heart Rate Researchers Study the Link Between Vitamin D and Inflammation Scientists May Need to Rethink How Genomics Impacts Risk for OCD 'Deepfaking the Mind' Could Improve Brain-Computer Interfaces for People with Disabilities New Cell Database Paints Fuller Picture of Muscle Repair Promising Treatment for Alexander Disease Moves to Human Clinical Trials Hemolung Respiratory Assist System Receives FDA De Novo Clearance Surviving COVID: Comorbidities Dont Tell the Full Story New Gene Identified that Contributes to Progression to Type 1 Diabetes Simple Surgical Technique Associated with Significant Reduction in the Risk of Atrial Fibrillation after Cardiac Surgery Researchers Discover New Insights About Tau Proteins in People Living with ALS Researchers Find Benefits and Drawbacks to Two-Step Surgical Approach for 'Leaky Heart Valves' Breaking Down Fungal Biofilm Defenses Provides Potential Path to Treating Sticky Infections Vascular Defects Appear to Underlie the Progression of Parkinson's Disease For Stem Cells, Bigger Doesnt Mean Better Dancing Molecules Successfully Repair Severe Spinal Cord Injuries Testicular Tissue Cryopreservation Shown to Be a Safe and Feasible Option of Male Fertility Preservation Fat-Secreted Molecule Lowers Response to Common Cancer Treatment Immunotherapy-Chemotherapy Treatment Coupled with In-Depth Genomic Analyses Leads to Improved Survival for Patients with Mesothelioma Scientists Identify Mechanism that May Influence Infectivity of SARS-Cov-2 Variants Arginine, an Inexpensive Oral Drug, Could Enhance Radiation Therapy for Cancer Blood Plasma Protein Fibrinogen Interacts Directly with Nerve Cells to Cause Brain Inflammation Researchers Investigate Role of Gene Associated with Alzheimers Disease in Brains Immune Cells FLASH Registry Interim Data Demonstrating Benefits of Lytic-Free Mechanical Thrombectomy Novel Computational Pipeline Could Help Repurpose Cancer Drugs for Rare Diseases A New Breakthrough for Treatment of Male Infertility Molecular Atlas of Senescent Cells Could Chart Way to Therapies for Age-Related Diseases and Cancer Newly Patented Device Anchored in 50+ Years of Musculoskeletal Research Podcast: Synthetic Biology and Genetic Therapeutics with Dr. Samira Kiani Chemo Helps Breast Cancer Cells Get Their Foot in the Door to the Lungs Researchers Boost Human Mental Function with Brain Stimulation Noninvasive Imaging Strategy Detects Dangerous Blood Clots in the Body Uncovering How Injury to the Pancreas Impacts Cancer Formation Drug-Like Molecule Points to Novel Strategies for Cancer Therapy New Type of Nerve Cell Discovered in the Retina Dopamines Many Roles, Explained Immunotherapy May Benefit Patients with Cancer that has Spread to Tissues Around the Brain Potentially Harmful Industrial Chemicals Detected in US Fast Foods Cancer Cells Change Shape, How They Move to Invade Different Types of Tissue Call-and-Response Circuit Tells Neurons When to Grow Synapses Cell-Free DNA Identifies Early Signs of Relapse in Pediatric Medulloblastoma Novel Gene Therapy Platform Speeds Search for Ways to Cure Blindness Development of Advanced Drug Delivery Systems to Address Global Environmental Challenge Podcast: Cardiovascular Services with Mr. Stephen Winowich Aging Breast Tissue Could Set the Stage for Invasive Breast Cancer Accelerating the Discovery of New Materials for 3D Printing Molecular Atlas of Small Cell Lung Cancer Reveals Unusual Cell Type That Could Explain Why Its So Aggressive Study Could Pave Way for Creating Safer Opioids Aided By Stem Cells, a Lizard Regenerates a Perfect Tail for First Time in More Than 250 Million Years Dopamine Fasting: Is It Possible? Dr. Elizabeth Wayne Awarded NIH R35 Grant for Macrophage Polarization Research Podcast: Tissue Engineering and Wound Healing with Dr. Neill Turner New Material Aids in Neural Stimulation BRAIN Initiative Funding Received for BCI Development and Testing Pneumococcal Extracellular Vesicles Modulate the Immune Response Nerve Repair, with Help from Stem Cells Researchers Identify New Drug Target for Blood Cancer, Potentially Solid Tumors Promising Results for Parkinson's Disease Treatment Gel Enhances CAR-T Immunotherapy Benefits in Brains Surgically Treated for Glioblastoma Neuroscientists Roll Out First Comprehensive Atlas of Brain Cells Signaling From Neighboring Cells Provides Power Boost Within Axons Blood Marker Could Help ID Those at Risk of Debilitating Peripheral Artery Disease Convalescent Plasma Futile as Treatment for Critically Ill COVID-19 Patients Podcast: Lifestyle Medicine with Drs. Yoram Vodovotz and Michael Parkinson COVID Antibody Tests: Are They Necessary? Using AI to Treat Acute Kidney Injuries Identification of Therapeutic Strategies to Prevent or Halt Progression of Chronic Liver Diseases Natural Compound in Basil May Protect Against Alzheimers Disease Pathology New Mouse Model Unlocks Drug Testing of Hormone-Sensitive Human Breast Cancer Comb Breathalyzer Is Now a Thousandfold More Sensitive to Disease Biomarkers Calculating the Path of Cancer Scientists Reverse Pancreatic Cancer Progression in Time Machine Made of Human Cells Powerful Technique Details Brain Tumors Formidable Resiliency Gene Therapy Can Restore Vision After Stroke Podcast: Ectopic Organogenesis with Drs. Lagasse and Hufford Researchers Identify Mutations of Delta, Delta Plus Variants Living Retina Achieves Sensitivity and Efficiency Engineers Can Only Dream About Engineers Grow Pancreatic 'Organoids' that Mimic the Real Thing Are COVID Variants Treated Differently, or Is COVID Just COVID? Lightening the Load of Multi-Material Manufacturing with 3D Printing Scientists Find a New Way to Reverse Immune Suppression in Tumors Link Between Inflammation and Pancreatic Cancer Development Uncovered Physical Distance May Not Be Enough to Prevent Viral Aerosol Exposure Indoors UPMC and Pitt Provide First Results of Largest Comparative Randomized Trial of Monoclonal Antibody Treatment for COVID-19 Controlling the Output Signals of the Basal Ganglia Preventing the Long-Term Effects of Traumatic Brain Injury Decreased Mortality for Patients with Complex Aortic Aneurysms Treated by Fenestrated-Branched Endovascular Aortic Repair Smart Dental Implants Free Radicals Linked to Heart Damage Caused by Cancer Research Uncovers New Mechanism that Promotes Wound Healing in Skin Metabolic Changes in Plasma and Immune Cells Associated with COVID-19 Severity, Can Predict Patient Survival Study Illuminates Origins of Lung Cancer in Never Smokers Why Are Only Some Cells Competent to Form Cancer? Engineered Mini CRISPR Genome Editing System Developed Drug Cocktail Reduces Aging-Associated Disc Degeneration Engineering CAR T Cells to Deliver Endogenous RNA Wakes Solid Tumors to Respond to Therapy Novel Mechanism Links Genetic Defect in IBD Patients to Gut Leakiness Stem-Like T Cells Could Aid Immunotherapy in Cancer Treatment New Molecular Device Has Unprecedented Reconfigurability Reminiscent of Brain Plasticity Bionic Arm Restores Natural Behaviors in Patients with Upper Limb Amputations Predicting Complications Postpartum Through TED-Ed, Dr. Elizabeth Wayne Explains mRNA Technology and COVID Vaccines Genes Can Respond to Coded Information in Signals or Filter Them Out Entirely Improving Strength, Stretchiness, and Adhesion in Hydrogels for Wound Healing Novel Assessment of Platelet-Rich Plasma Treatment Shows Efficacy in Patients with Osteoarthritis Reducing Sugar in Packaged Foods Can Prevent Disease in Millions Brain Tissue Inflammation Is Key to Alzheimer's Disease Progression Biomarker May Help Predict Benefits of Immunotherapy Walking Its in Your Genes! Finding Inspiration to Rebuild Human Heart Muscle Novel AI Blood Testing Technology Can ID Lung Cancers with High Accuracy Preclinical Study Defines the Spleen-Heart Connection in Cardiac Repair Antibody Protects Against Broad Range of COVID-19 Virus Variants Scientists Harness Human Protein to Deliver Molecular Medicines to Cells Scientists Growing More Complex and Mature Heart Tissue in the Lab Engineers Grow 3D-Bioprinted Blood Vessel Army Research Laboratory Funds Quantum Biology Project Double Lung Transplant Done Twice UPMC-Pitt Researchers Receive Grant to Advance Liver Organoids Dr. Tracy Cui Receives Chancellors Gap Project Funding Existing Drug May Help Improve Responses to Cellular Therapies in Advanced Leukemias Study Details Robust T-Cell Response to mRNA COVID-19 Vaccines -- A More Durable Source of Protection Researchers Solve Structure of BRCA2 Protein Complex Important in DNA Repair CRISPR Gene Editing Tech Leads to New Insights About Hypertrophic Cardiomyopathy Toward Next-Generation Brain-Computer Interface Systems Discovery Raises Possibility of New Medication for Alzheimers, Parkinsons New Biomarkers May Detect Early Eye Changes that Can Lead to Diabetes-Related Blindness Dr. Peter Rubin Leads Clinical Trial Assessing Treatment of Partial Thickness Burns Researchers Develop Coating for Endotracheal Tubes that Releases Antimicrobial Peptides Dr. Kathryn Whitehead Participates in TED/Monteray Blood Thinners Reduce Need for Cardiovascular and Respiratory Support in Certain COVID-19 Patients Study Identifies Molecule that Stimulates Muscle-Building in Humans Ovarian Cancer: Potential Therapeutic Target Identified A More Complete Molecular Picture of Lung Squamous Cell Carcinoma Comes into View New Drug Combo Shows Early Potential for Treating Pancreatic Cancer 'Feel Good' Brain Messenger Can Be Willfully Controlled, New Study Reveals ISSRDC Highlights Opportunities Within Biomanufacturing in Space Dr. Q&A: Plastic vs Cosmetic Surgery with Dr. Peter Rubin Dynamic Heart Model Advances Engineered Heart Tissue Tech Statins May Improve Survival for Triple-Negative Breast Cancer Patients Scientists Boost Gene Knockdown in Human Cells via Chemically Modified RNA CRISPR New Treatment Option for Advanced Urothelial Cancer Patients Shows Promise in a Phase 2 Clinical Trial Miniature Brain Models Developed to Study Causes of Alzheimers Disease and to Test Drugs in Development T Cell Response Not Critical for Immune Memory to SARS-CoV-2 or Recovery from COVID-19, Study Finds Advanced Bladder Cancers Respond to Immunotherapy Regardless of Gene Mutation Status Comprehensive Clinical Sequencing Opens Door to the Promise of Precision Medicine Brain-Repair Discovery Could Lead to New Epilepsy Treatments New Organ-On-A-Chip Finds Crucial Interaction Between Blood, Ovarian Cancer Tumors Hunting for TB's Most Vulnerable Genes Pitt-UPMC Scientists are Inventing mRNA Vaccine to Cure Liver Failure Dr. John Pacella to Serve as Co-Investigator on NHLBI Grant COVIDs Effects on Kids Vascular Bioengineering Lab Receives Funding to Track Aneurysms and Predict Rupture BNP Test: Critical for PPCM Patients Like Priming a Pump, Changes in Cells Damaged by Chronic Lung Disease Can Result in Severe COVID-19 A New, Inexpensive Way to Heal Chronic Wounds Novel Approach for Developing New Antibiotics Novel Autoantibody Adds Fuel to COVID-19 'Firestorm' of Inflammation, Blood Clots RNA Modification May Protect Against Liver Disease Researcher Creates Cell Lines to Help Treat Mitochondrial Diseases in Children Recent Study Identifies 11 Candidate Genetic Variants for Alzheimer's Disease Preventing Lung Cancer's Unwelcome Return Research Offers New Insight for Treating Aggressive Form of Breast Cancer Our Genes Shape Our Gut Bacteria Biomaterial Vaccines Ward Off Broad Range of Bacterial Infections and Septic Shock Tooth Loss Associated with Increased Cognitive Impairment, Dementia Gene Therapy in Early Stages of Huntington's Disease May Slow Down Symptom Progression Microscopy Technique Makes Finer Images of Deeper Tissue, More Quickly Discovery Shows How Tuning the Immune System May Enhance Vaccines and Ease Disease The Brain's Wiring Technicians Missing Bile Ducts Offer Clues to Mechanism of Liver Injury ECM a Part of VML Treatment Study: Immunocompromised Response to COVID-19 Vaccination Divers Have Brain Oxygen Levels Even Lower Than Seals During Deep Dives UPMC, Pitt Pediatricians Make Rare Disease Breakthrough Exploring Silks Full Potential Nanotechnology May Help Improve Organ Transplantation Outcomes International Research Provides Insight into How Fibrosis Can Start and Become Devastating in Different Body Tissues Modeling Womens Health After Childbirth Pitt TEDx 2021: William Wagner, PhD Kozai Lab Student Receives NIH F99/K00 Pre-To-Postdoc Award to Improve Brain Implants SURGIMESH Benefits Hernia Patients Gamifying Vision: How Mobile Gaming Is Tracking Vision Degradation in Patients Dr. Kacey Marra Receives $2M DOD Grant for Nerve Guide Work Pitt Scientists Who Regrew Retina Cells to Restore Vision in Tiny Fish Set Their Sights on Humans Landmark Data Presented for ZFUZE Surgical Polymer Injection of Light-Sensitive Proteins Restores Blind Mans Vision Sense of Touch Improves Control of Robotic Arm Roy Lab Student Abigail Allen Receives NIH F31 for Her Cardiovascular Research Dr. Kenton Gregory to Support Development of AI-Based Applications for Mass Casualty Events Engineering Smarter Stents Dr. Mo Ebrahimkhani Explains a Machine Learning-Enabled Shortcut to Engineer Human Liver Organoids Novel Immunotherapy Boosts Long-Term Stroke Recovery in Mice COVID-19 Monoclonal Antibody Treatment Reduces Risk of Hospitalization and Death in UPMC Patients Implantable Living Pharmacy Could Control Bodys Sleep/Wake Cycles No Benefit to Tubes Over Antibiotics for Ear Infections Partnership with OmniLife to Support the Starzl Network for Excellence in Pediatric Transplantation Engineered Organism Could Diagnose Crohn's Disease Flareups Proteins That Predict Future Dementia, Alzheimer's Risk, Identified Epigenetic Changes Drive the Fate of a B Cell New Inhibitor Against Key Leukemia Protein The Eyes Offer a Window into Alzheimer's Disease Dr. Howard Edington Offers T-VEC Injections for Some Patients with Advanced Melanoma Prosthetic Hook Mouse for People with Upper-Limb Amputations New Evidence Links Gut Bacteria and Neurodegenerative Conditions Molecular Analysis Identifies Key Differences in Lungs of Cystic Fibrosis Patients Organ Transplant Recipients Remain Vulnerable to COVID-19 Even After Second Vaccine Dose Work of Dr. Eric Lagasse Highlighted in Forbes Protein Linked to Sex Differences in Age-Related Neuron Loss Intranasal Influenza Vaccine Enhances Immune Response and Offers Broad Protection The Micro-Environment of Breast Cancer in Three Dimensions New Brain-Like Computing Device Simulates Human Learning Engineering T Cells to Attack Cancer Broadly New Cell Atlas of COVID Lungs Reveals Why SARS-Cov-2 Is Deadly and Different Preclinical Discovery Triggers Wound Healing, Skin Regeneration Researchers Identify Protein Produced After Stroke that Triggers Neurodegeneration Combined Therapies Increase Treatment Options for Patients with Chronic Lung Diseases Study Reveals Roadmap of Muscle Decline with Age Federal Policy to Reduce Sepsis Deaths Mostly Ineffective Breast Cancer Treatment in Those Over 70 Can Be Reduced Skin and Bones Repaired by Bioprinting During Surgery Body's Natural Pain Killers Can Be Enhanced Fight or Flight Response May Hinge on Protein in Skeletal Muscular System Experimental Drug Shows Potential Against Alzheimer's Disease DNA Robots Designed in Minutes Instead of Days Microglia, Stockholm Syndrome and Miraculous Cures in Glioblastoma Patients Neural Plasticity Depends on this Long Noncoding RNA's Journey from Nucleus to Synapse Attacking Aortic Aneurysms Before They Grow Treatment Not Always Needed to Prevent Vision Loss in Patients with Elevated Eye Pressure New CRISPR Technology Offers Unrivaled Control of Epigenetic Inheritance Gene Therapy Shows Promise in Initial Trial for Patients with Childhood Blindness New Discovery Could Lead to Therapies for Patients with Duchenne Muscular Dystrophy Self-Assembling Nanofibers Prevent Damage from Inflammation Certain Cancer Patients at Risk of COVID-19 Vaccine Failure Studying the Mechanism Behind Metastatic Breast Cancer PNA-Based Technique an Essential Part of the Gene Editing Toolkit Long-Term Care Residents Mount Antibodies to COVID Vaccines Unlocking Richer Intracellular Recordings Powered Prosthetic Ankles Can Restore a Wide Range of Functions for Amputees New Biosealant Can Stabilize Cartilage, Promote Healing After Injury Imbalance in Gum Bacteria Linked to Alzheimer's Disease Biomarker Pain Receptors Linked to the Generation of Energy-Burning Brown Fat Cells Study Reveals Crucial Details on Skin-Related Side Effects of Cancer Immune Therapies Personalized Cancer Vaccine Deemed Safe, Shows Potential Benefit Against Cancer Scientists Discover 'Jumping' Genes That Can Protect Against Blood Cancers DIY Device Climbs to the Top of the Charts A Super Researcher COVID-19: Tsunami of Chronic Health Conditions Expected, Research and Health Care Disrupted New Method Expands the World of Small RNAs New Blueprint of Brain Connections Reveals Extensive Reach of Central Regulator Thirteen New Alzheimer's Genes Identified in Human Genome Study Software Package Enables Deeper Understanding of Cancer Immune Responses Scientists Scour Genes Of 53,000+ People to Better Battle Dangerous Diseases Experimental Antibodies for Parkinson's, Alzheimer's May Cause Harmful Inflammation Nightly Sleep of Five Hours, Less, May Increase Risk of Dementia, Death Among Older Adults Pitt Skin Patch Vaccine Partners with Cambridge COVID-19 Biotech Startup COVID-19 Treatment Reduces Risk of Hospitalization, Death Signals from Muscle Protect from Dementia Long-Term Space Travelers Will Need High-Intensity Exercise to Protect Heart Health Procedures Identify Barrett's Esophagus Patients at Risk for Cancer Progression First Detailed Look at Crucial Enzyme Advances Cancer Research GlyNAC Improves Multiple Defects in Aging to Boost Strength and Cognition in Older Humans Correcting Altered Brain Circuit Could Tackle Coinciding Obesity and Depression How Cells Transport Molecules With 'Active Carpets' Pre-Pandemic Hospital Surge Capacity 'Time Capsule' ALung Announces a Key Milestone Achievement in Its VENT-AVOID Pivotal Trial Stem Cells Derived from Fat Show Promise as a Treatment for Mass Radiation Exposure Weekly Insulin Helps Patients with Type 2 Diabetes Achieve Similar Blood Sugar Control to Daily Insulin How RNA Editing Affects the Immune System Health Declining in Gen X and Gen Y, US Study Shows New Antibiotic Clears Multi-Drug Resistant Gonorrhea in Mice in Single Dose Could Leak in Blood-Brain Barrier Be Cause of Poor Memory? Pancreatic Cancer Tumors Use Multiple Mechanisms to Avoid Starvation: New Target for Treatment? Chemical Cocktail Creates New Avenues for Generating Muscle Stem Cells Registration Now Open for Virtual Pitt Health Academy: Research in Orbit Researchers at University of Pittsburgh Design Active Materials for Self-Regulating Soft Robots Pitt and RevBio to Conduct an In Vivo Bone Experiment on the International Space Station A Joint Effort to Improve Shoulder Surgery Thirteen Things Primary Care Clinics Can Check to Help Preserve Brain Health RNA Editing Protein ADAR1 Protects Telomeres and Supports Proliferation in Cancer Cells Study Suggests Role of Sleep in Healing Traumatic Brain Injuries Cancer Cells May Evade Chemotherapy by Going Dormant Imaging the Human Eye: Detailed Images of Rod and Cone Photoreceptors Immune Cell Implicated in Development of Lung Disease Following Viral Infection Study of Coronavirus Variants Predicts Virus Evolving to Escape Current Vaccines Novel Urine Test Developed to Diagnose Human Kidney Transplant Rejection Vision Impairment Is Associated with Mortality New Potential for Functional Recovery After Spinal Cord Injury Artificial Intelligence Reveals Current Drugs That May Help Combat Alzheimer's Disease Food for Thought: New Maps Reveal How Brains Are Kept Nourished Division of Labor Within Regenerating Liver Maintains Metabolism, Mouse Study Finds Advancements in Vision Care Lead the Way in Hillman Foundation $25 Million Gift Two New Models Boost Accuracy in Assessing Which COVID-19 Patients Face the Greatest Risk of Mechanical Ventilation and Death How Bacteria Defeat Drugs that Fight Cystic Fibrosis New Shape-Changing 4D Materials Hold Promise for Morphodynamic Tissue Engineering 'Walking' Molecule Superstructures Could Help Create Neurons for Regenerative Medicine Early-Warning for Seizures Could Be a Game-Changer for Epilepsy Patients Hypertensive Pregnancy Linked with Risks of Heart Disease Commonalities Found Between Viral Infections and Ovarian Cancer Neurologists Identify Consistent Neuroinflammatory Response in ICH Patients How a Longevity Gene Protects Brain Stem Cells from Stress New Potential Therapy for Crohn's Disease in Children Never-Before-Seen Antibody Binding, Informing Liver Cancer, Antibody Design Using a Machine Model to Predict Risk of Human Aneurysms Pitt Researchers Solve Mystery of Metabolic Dysfunction in Psychiatric Patients Liver Research Papers Published Experts Study ACL Injury Features with 3D Statistical Shape Modeling Dr. George Michalopoulos Awarded R01 Pitt-McGowan Institute Center for Preclinical Studies Supports Total Artificial Heart Study New Immunotherapy Target Discovered for Malignant Brain Tumors New Surgery May Enable Better Control of Prosthetic Limbs Immunotherapy -- Targeted Drug Combination Improves Survival in Advanced Kidney Cancer New Prostate Cancer Test Could Avoid Unnecessary Biopsies Six Pills for a Longer and Better Life Study Examines Social Determinants of Disparities in Kidney Transplantation Larger Panel Finds More Gene Mutations, Treatment Targets for Leukemia Turning on the Switch for Plasticity in the Human Brain Scientists Find Key Function of Molecule in Cells Crucial for Regulating Immunity Genome-Editing Tool TALEN Outperforms CRISPR-Cas9 in Tightly Packed DNA Getting Under Your Skin: Molecular Research Builds New Understanding of Skin Regeneration Pitt Scientists Find the Key to Viral-Bacterial Co-infection Microscopic Look at Aneurysm Repair Drs. Alejandro Almarza and Juan Taboas Awarded NIH R01 Grant A Potential New Therapeutic Target for Kidney Cancer Saving Baby Teeth to Treat Future Medical Needs Fine Tuning First-Responder Immune Cells May Reduce TBI Damage Newly Discovered Subset of Brain Cells Fight Inflammation with Instructions from the Gut Finding a Way to Stop Chemotherapy from Damaging the Heart Possible New Combo Therapy for Head and Neck Cancer Immune System Mounts a Lasting Defense After Recovery from COVID-19, Researchers Find Breathing Easier with a Better Tracheal Stent Dr. Mario Solari Receives MTF Biologics Allograft Tissue Research Grant U.S. FDA and University of Pittsburgh Announce Collaboration to Research and Develop Innovative Therapies to Help Restore Vision Study Demonstrates Efficacy of New Treatment for Neurofibromatosis Type 1-Related Tumors Flip the Script: Cardiac Rehabilitation Is Underused, but a Simple Change Could Fix That Researchers Discover New Inhibitor Drug Combination for Rare Form of Cancer Scientists Uncover New Path Toward Treating a Rare but Deadly Neurologic Condition Target Discovered that Halts Osteoarthritis-Type Knee Cartilage Degeneration Model Analyzes How Viruses Escape the Immune System New Insights into the Control of Inflammation METAvivor Translational Research Award Received by Dr. Steffi Oesterreich One in Five Brain Cancers Fueled by Overactive Mitochondria 'Invisible' Stem Cells Evade Natural Killer Cells Using Immune 'Off-Switch' Gene Therapy Strategy Found Effective in Mouse Model of Hereditary Disease TSC Gut Cells Sound the Alarm When Parasites Invade Gut Microbe May Promote Breast Cancers Nanoparticle Vaccine for COVID-19 Brain Imaging Predicts PTSD After Brain Injury Improving the Efficiency of Neural Stem Cell Delivery to the Area of Stroke Dr. Youngjae Chun Receives Second-Year Research Funding from The Childrens Heart Foundation Study Points the Way to Boost Immunotherapy Against Breast Cancer, Other Solid Tumors Scientists Explore Deficits in Processing Speed in Individuals with Spinal Cord Injury Potential New RX Strategy for Stroke Blood Vessel Cells Implicated in Chronic Inflammation of Obesity Discovery About How Cancer Cells Evade Immune Defenses Inspires New Treatment Approach New Class of Antibiotics Active Against a Wide Range of Bacteria Drug Discovery Study Identifies Promising New Compound to Open Constricted Airways Stress May Awaken Dormant Cancer Cells The Force to Shape an Organ New Way to Deliver DNA-Based Therapies for Diseases Stroke and Altered Mental State Increase Risk of Death for COVID-19 Patients Study in Mice Shows Genes May Be Altered Through Drug Repurposing Long Non-Coding RNA May Play a Key Role in Cardiovascular Disease Growing Human Organs for Transplantation with New Proof-of-Concept Purifying Widely Used Antibiotic Could Reduce Risk It Poses to Hearing, Study Finds Fibrous Protein Finding May Lead to Improved Bioprinting, Tissue Engineering Potential Treatment Approach Kills Lymphoma While Sparing Healthy Cells Regenerative Medicine Patient Runs 5K Race in 2020 After Above-the-Knee Amputation in 2015 Where Applied Biophysics Meets Tissue Engineering and Cellular Therapies Phase III Clinical Trial Data of Gene Therapy to Treat Leber Hereditary Optic Neuropathy Published New Combination Therapy Could Help Fight Difficult-to-Treat Cancers with Common Mutations Lab-Grown Human Brain Organoids Mimic an Autism Spectrum Disorder, Help Test Treatments Evolution May Be to Blame for High Risk of Advanced Cancers in Humans We're Watching the World Go Blind, Researchers Say Can We Make Bones Heal Faster? Dr. Nathan Bahary Expands on Recent Advances with Actionable Alterations Spanning GI Cancers Two Teams of Pitt Students Launch Experiments to International Space Station Overlooked Treatment May Improve Survival Rates for Ovarian Cancer Patients Researchers Use Genomics to Identify Diabetic Retinopathy Factors Potential Cancer Therapy May Boost Immune Response Cervical Cancer Survival May Improve by Targeting Senescent Novel Form of Alzheimer's Protein Found in Spinal Fluid Indicates Stage of the Disease Researchers Discover New Particle in the Blood of Septic Patients Researchers Urge Priority Vaccination for Individuals with Diabetes Synthetic Llama Antibodies Rescue Doomed Proteins Inside Cells Synthetic Biology and Machine Learning Speed the Creation of Lab-Grown Livers Podcast: Dr. Ioannis Zervantonakis Discusses the Microenvironment of Tumors COVID-19 Studies Should Also Focus on Mucosal Immunity, Researchers Argue Podcast: Sports Guidelines During COVID-19 Researchers Unlock the Door to Tumor Microenvironment for CAR T Cells Study Revealing the Secret Behind a Key Cellular Process Refutes Biology Textbooks Channeling the Immune System for Head and Neck Cancer COVID-19 Response Update with Dr. Derek Angus Positive Effects of Physical Activity in Bariatric Surgery Patients 3D Bioprinted Heart Provides New Tool for Surgeons Discovery Illuminates How Cell Growth Pathway Responds to Signals Potential Cellular Target for Eliminating Bone Breakdown in Osteoporosis Found Scientists Discover Roles for a Cellular Motor in Cancer How Tissue Geometry Influences the Movement of Cells Through the Body Motorized Sensors Aim to Improve and Speed Up Early-Stage Disease Diagnosis A Change of Heart: New Drug for HCM Reduces Heart Mass Cellular Pathway of Genetic Heart Disease Similar to Neurodegenerative Disease Podcast: Whats New in Military Medicine with Dr. Ron Poropatich Holistic Way to Look at Neurons in the Brain Research Identifies 'Volume Control' in the Brain that Supports Learning and Memory Framework to Study Brain Connectivity in Living Organisms Hydroxychloroquine Doesn't Help COVID-19 Inpatients Genetic Mutation Could Worsen Heart Function in Duchenne Muscular Dystrophy Patients New Insights on a Common Protein Could Lead to Novel Cancer Treatments Scientists Create Hybrid Tissue Construct for Cartilage Regeneration Implantable Device Can Monitor and Treat Heart Disease Microfluidics Helps Engineers Watch Viral Infection in Real Time Genomic Study Reveals Role for Hypothalamus in Inflammatory Bowel Disease Updated Heart Transplant Allocation Policy Evaluated Melding Biology and Physical Sciences Yields Deeper Understanding of Cancer Novel Adoptive Cell Transfer Method Shortens Timeline for T-Cell Manufacture Ultrapotent COVID-19 Vaccine Candidate Designed Via Computer How the Immune System Deals with the Gut's Plethora of Microbes Proton Regulator of Essential Cancer MicroRNA Enrollment of the First Patient in the Immune Modulation Domain of REMAP-COVID Questionnaire-Based Tool Measures Fatigue in Patients Receiving Dialysis Gene Therapy Treatment for Retinitis Pigmentosa Receives $58 Million Financing Roy Lab Research Featured in JBC Special Virtual Issue DiFusions New ZFUZE Biomaterial Data Beats Titanium in Multiple Studies Dr. Bradley Nindl to Co-PI Study on Gender Integration at Marine Corps Boot Camps Scientists Use Clues in the Human Genome to Discover New Inflammatory Syndrome New Insights into a Potential Target for Autoimmune Disease 'White Matter Lesion' Mapping Tool Identifies Early Signs of Dementia New Map of the Immune Landscape in Pancreatic Cancer Could Guide Immunotherapy DrugCell: New Experimental AI Platform Matches Tumor to Best Drug Combo Toward a New Staging System for Prostate Cancer, and Why It Matters Dr. Stephen Badylaks Work Featured on Life 2.0: Body Shop Dr. Catalin Toma Reports Interim FLASH Registry Results on FlowTriever System Getting the Full Scope For COVID-19, Immune System Can Be A Hero or A Villain Dr. Alejandro Soto-Gutierrez Receives NIH Funding to Use Tiny, Bioengineered Organ Models to Improve Clinical Trials Development and Design Investigational ALS Drug Prolongs Patient Survival in Clinical Trial Octopus-Inspired Sucker Transfers Thin, Delicate Tissue Grafts and Biosensors Treating Ringing in the Ears with Sound and Electrical Stimulation of the Tongue Pinpointing the 'Silent' Mutations that Gave the Coronavirus an Evolutionary Edge Protein that Keeps Immune System from Freaking Out Could Form Basis for New Therapeutics Reviving Cells After a Heart Attack Total Deaths Recorded During the Pandemic Far Exceed Those Attributed to COVID-19, New Data Show Experimental Glioblastoma Therapy Shows Curative Powers in Mice Models Drug Delivery Systems to Treat Connective Tissue Disorders Novel Testing Platform Designed for Breast Cancer Cells Process for Regenerating Neurons in the Eye and Brain Identified Researchers Demonstrate How Changing the Stem Cell Response to Inflammation May Reverse Periodontal Disease Personalized Cancer Therapy Improves Outcomes in Advanced Disease Risk Factors for Acute Kidney Injury After Brain Hemorrhage Cancer Cells Use Nerve-Cell Tricks to Spread from One Organ to the Next Gene Expression Altered by Direction of Forces Acting on Cell First 'Pathoconnectome' Could Point Toward New Treatments for Neurodegenerative Diseases Study Shows How COVID-19 Could Lead to Runaway Inflammation npj Regenerative Medicine: Meeting Report of 8th Annual International Symposium on Regenerative Rehabilitation Now Available Monitoring Coronary Artery Disease in Real-Time Dr. Dennis McNamara to Lead Cardiol Therapeutics Phase II/III COVID-19 Trial Catalyzing an Improved Arterial Bypass Graft An Approach to the Protein Aggregation Problem in Therapeutic Bioprocessing HERL Receives Patent for Computer Pointing Device Last-Resort Life Support Option Helped Majority of Critically Ill COVID-19 Patients Survive Twinkling, Star-Shaped Brain Cells May Hold the Key to Why, How We Sleep COVID-19 'Prediction Model' Uses Data that Can Help Determine if Patients' Conditions Are Likely to Worsen Soft Robots, Origami Combine for Potential Way to Deliver Medical Treatments Regulatory T Cells Could Lead to New Immunotherapies Aimed at Treating Multiple Sclerosis Team Receives $1M NSF Award to Create At-Home Glaucoma Monitoring Device Mesoscale Diffusion MRI of the Ex Vivo Human Hippocampus Rapid Blood Test Could Detect Brain Injury in Minutes Tailor-Made Polymers Easier to Obtain Scientists Advance Understanding of Blood-Brain Barrier Health AI Could Expand Healing with Bioscaffolds Artificial Intelligence Detects Arthritis Before It Develops Researchers Discover New Molecules for Tracking Parkinson's Disease Novel Mechanism May Confer Protection Against Glaucoma New Path to Neuron Regeneration After Spinal Cord Injury A New Approach to Understanding the Biology of Wound Healing Abbott Lab Student Helps Build Silk Scaffolding for Tissue Calcium Helps Build Strong Cells New Treatments for Deadly Lung Disease Could Be Revealed by 3D Modeling Telomere Length Varies Across Human Tissue Types Role of Protein in Development of New Hearing Hair Cells COVID-19 May Have Been in Los Angeles as Early as Last December, Study Suggests Gene That Drives Ovarian Cancer Identified Antibiotic Molecule Enables Immune System to Kill HIV Infected Cells Plexiglass Alone Can't Protect Against Aerosolized Virus Editing the Immune Response to Boost Gene Therapy Steroids Improve Survival in Very Ill COVID-19 Patients Predictive Placentas: Using Artificial Intelligence to Protect Mothers Future Pregnancies Common Class of Drugs Linked to Increased Risk of Alzheimer's Disease Tiny Biological Package Gets Drug Right to the 'Heart' of Transplant Rejection Therapeutic Testbed for Age-Related Macular Degeneration Diabetes-in-a-Dish Model Uncovers New Insights into the Cause of Type 2 Diabetes Structure of mRNA Initiation Complex Could Give Insight into Cancer and Other Diseases Scientists Use Two Powerful Immunotherapies to Eradicate Solid Tumors Organ Regeneration Technology Is Focus of Four Peer-Reviewed Publications Study Explains Multipronged SARS-CoV-2 Attack and Widepread COVID-19 Infection Researchers 3D-Print Lifelike Heart Valve Models Phase 1 Human Trials Suggest Breast Cancer Drug Is Safe, Effective Tethering Together Type 2 Diabetes Drugs Increases Efficacy of Combination Therapy Single-Cell RNA Sequencing Sheds New Light on Cancer Cells' Varied Response to Chemotherapy Pigs Grow New Liver in Lymph Nodes, Study Shows $31 Million Received to Study Regenerative Therapy Solutions for Dental, Oral, and Craniofacial Medicine Heart Repair Factor Boosted by RNA-Targeting Compound Each Human Gut Has a Viral 'Fingerprint' Nasal Vaccine Against COVID-19 Prevents Infection in Mice Fighting Cancer with Rejection-Resistant, 'Off-The-Shelf' Therapeutic T Cells Heart Attack Damage Reduced by Shielded Stem Cells Surgical Benefits of Artificial Intelligence Scientists Demonstrate How Genetic Variations Cause Eczema Potential New Approach Against Fatal Childhood Brain Cancer Lack of Females in Drug Dose Trials Leads to Overmedicated Women Experimental COVID-19 Vaccine Prevents Severe Disease in Mice Pollution Linked to Antibiotic Resistance Dr. Kacey Marra Forms AxoMax Technologies to Commercialize Nerve Repair Research Blood-Thinner with No Bleeding Side-Effects Is On the Horizon Newly Discovered Mutation Could Point to Heart Disease Therapeutic Target Key to Dialogue Between Brain Cells to Protect Against Stroke A New Tool for Modeling the Human Gut Microbiome Strong Link Found Between Abnormal Liver Tests and Poor COVID-19 Outcomes Blood Test May Point to Patients at Higher Risk for COVID-19 Deterioration, Death Dr. Jenny Yu and the Treatment of Thyroid Eye Disease at Home Drs. Jelena Janjic and Vijay Gorantla Receive Department of Defense Research Grant SBIR Grant to Address Microvascular Obstructions U.S. Department of Transportation Grants $1 Million to Pitts New University Transportation Center New Understanding of CRISPR-Cas9 Tool Could Improve Gene Editing Researchers Discover Stem Cells in Optic Nerve that Preserve Vision Novel Diabetes Drug Candidate Shows Promising Properties in Human Islets and Mouse Models Discovery Will Allow More Sophisticated Work at Nanoscale The American Liver Foundation and UPMC Partner to Raise Awareness of Living-Donor Liver Transplants Podcast: Current Vision Research with Dr. José-Alain Sahel Analyzing Cells for Future Biomedical Devices Awarded 5-Year NIH Grant How COVID-19 Causes Smell Loss Neurons Are Genetically Programmed to Have Long Lives Lego-Inspired Bone and Soft Tissue Repair with Tiny, 3D-Printed Bricks Dual Role Discovered for Molecule Involved in Autoimmune Eye Disease Phage Therapy Shows Potential for Treating Prosthetic Joint Infections 'Self-Eating' Process of Stem Cells May Be the Key to New Regenerative Therapies New CRISPR C-to-G DNA Base Editor Expands the Landscape of Precision Genome Editing Researchers Simulate, Assess Damage to Brain Cells Caused by Bubbles During Head Trauma Researchers Use Cell Imaging and Mathematical Modeling to Understand Cancer Progression UPMC Childrens and Pitt Researcher Receives $2.59 Million NIH Grant for Diabetes Gene Therapy Spinal Stimulators Repurposed to Restore Touch in Lost Limb Podcast: Cardiothoracic Physician-Scientist Education/Training with Dr. Garret Coyan A Mechanical Way to Stimulate Neurons Synapse-Saving Proteins Discovered, Opening Possibilities in Alzheimer's, Schizophrenia New Nano Drug Candidate Kills Aggressive Breast Cancer Cells Gel That Breaks Down, Puts Itself Back Together Could Improve Delivery of Oral Drugs Scientists ID Gene Responsible for Deadly Glioblastoma Experimental COVID-19 Vaccine Safe, Generates Immune Response A Remote Control for Neurons McGowan Institute Faculty Receive Pitts Center for Medical Innovation Awards Umbilical Cord Blood Treats Rare Genetic Diseases Researcher Develops Method for Mapping Brain Cell Change, Development in Mice Artificial Energy Source for Muscle Physicians Give First Comprehensive Review of COVID-19's Effects Outside the Lung Study Sheds Light on How Cancer Spreads in Blood Gene Yields Insights into the Causes of Neurodegeneration Scientists Use Nanoparticle-Delivered Gene Therapy to Inhibit Blinding Eye Disease in Rodents Neurons Show Distinct Styles as They Interact with the Same Muscle Partner AR3T Receives 5-Year NIH Grant Extension Researchers Develop Software to Find Drug-Resistant Bacteria Compounds Halt SARS-Cov-2 Replication by Targeting Key Viral Enzyme How the Body Regulates Scar Tissue Growth After Heart Attacks Materials Scientists Drill Down to Vulnerabilities Involved in Human Tooth Decay Tiny Mineral Particles Are Better Vehicles for Promising Gene Therapy Producing a Gaseous Messenger Molecule Inside the Body, On Demand Dr. Sachin Velankar Receives NSF Grant Infant Heart-Assist Device Gets New Life with $4.7M Grant Reversing Drug Resistance in Breast Cancer Lab-Grown 'Mini-Brains' Suggest COVID-19 Virus Can Infect Human Brain Cells Reducing the Damage of a Heart Attack First Successful Delivery of Mitochondria to Liver Cells in Animals Promising Treatment to Slow Kidney Disease Doesn't Prove Out in Clinical Trial Viruses Can Steal Our Genetic Code to Create New Human-Virus Genes UPMC and VA Pittsburgh Partner to Perform VAs First Living-Donor Living Transplant Researchers Study a Novel Type of Extracellular Vesicles Genetic Variation May Affect Bacterial Composition and Healing of Wounds Scientists Decode How the Brain Senses Smell How Cancer Drugs Find Their Targets Could Lead to a New Toolset for Drug Development Light-Activated 'CRISPR' Triggers Precision Gene Editing and Super-Fast DNA Repair Diluting Blood Plasma Rejuvenates Tissue, Reverses Aging in Mice Cell-Soldiers Turn Out to Be More Resistant than Cell-Combat Medics A Micro Look at Metastatic Environments in Ovarian Cancer Wearable Patch May Provide New Treatment Option for Skin Cancer Disrupted Circadian Rhythms Linked to Later Parkinson's Diagnoses Susceptibility to Carcinogens Varies Due to Genetics Super-Potent Human Antibodies Protect Against COVID-19 in Animal Tests Researchers Model Human Stem Cells to Identify Degeneration in Glaucoma Novel Mechanism Triggers a Cellular Immune Response COVID-19 Mouse Model Will Speed Search for Drugs, Vaccines New Genetic Defect Linked to ALS You Make Me Sick Board Game Teaches Students About COVID-19 Immune System Discovery Could End Chronic Organ Rejection Podcast: Repopulation of the Stroke Cavity in the Brain with Dr. Michel Modo Podcast: Liver Disease Research and Potential Treatments with Dr. Alejandro Soto-Gutiérrez Podcast: Computational and Experimental Data Complementation with Dr. Lance Davidson Researchers Shed Light on New Enzymatic Reaction Preventing Pancreatic Cancer Metastasis by Keeping Cells 'Sheltered in Place' Tiny, Magnetically Powered Neural Stimulator Drug Researcher Develops 'Fat Burning' Molecule Researchers Help Bring Biofriendly Materials to Drug Design for Neuro Disorders Scientists Aim Gene-Targeting Breakthrough Against COVID-19 Scientists Engineer Human Cells with Squid-Like Transparency Lab-Grown Miniature Human Livers Successfully Transplanted in Rats Crafting a Better Graft Podcast: McGowan Institute-Developed TechnologyHemolung® RAS History, COVID-19 Patients, and Whats on the Horizon Podcast: Surgical Support Prior to Birth with Dr. Stephen Emery Podcast: Whats Being Done for Acute Kidney Stress/Injury with Dr. John Kellum How Americans Are Coping with COVID-19 Stress Squid Studies Suggest New Route to Therapy for ALS, Targeting Synaptic Dysfunction Study Charts Developmental Map of Inner Ear Sound Sensor in Mice An Imbalance of Electrons in the Liver May Be a Common Risk Factor for Disease Fountain Therapeutics Closes $6 Million Series A-1 Financing Study Reveals First Evidence Inherited Genetics Can Drive Cancer's Spread Scientists Identify Chemicals in Noxious Weed that 'Disarm' Deadly Bacteria Cancer Researchers Locate Drivers of Tumor Resistance Protein Shapes Matter in Alzheimer's Research Decoding the Massively Complex Gut Microbiome New Ways to Nudge the Brain Dr. David Gau Receives National Cancer Center Fellowship for Kidney Cancer Research Aging Neurons Accumulate DNA Damage Scientists Find Brain Center that 'Profoundly' Shuts Down Pain Heart Attacks, Heart Failure, Stroke: COVID-19's Dangerous Cardiovascular Complications Retinal Texture Could Provide Early Biomarker of Alzheimer's Disease New Imaging Tool Helps Researchers See Extent of Alzheimer's Early Damage Using a Smartphone to Diagnose COVID-19 at Home European Society of Cataract & Refractive Surgeons Podcast: Dr. Jenny Yu Carnegie Mellon, Pitt Researchers Launch Ventilator Project Engineering a New Model for Respiratory Infection Treatment Link Between Blood Vessel Inflammation, Malfunctioning Cellular Powerhouses Researchers ID Target for Colorectal Cancer Immunotherapy Certain Foods Common in Diets of US Adults with Inflammatory Bowel Disease Eyes Send an Unexpected Signal to the Brain Scientists Regenerate Neurons in Mice with Spinal Cord Injury and Optic Nerve Damage Drs. Alan Wells and Louis Falo Receive Clinical and Translational Science Institute Awards to Support Urgent COVID-19 Research FDA Grants ALung Technologies Emergency Use Approval for its Hemolung to Treat COVID-19 Patients with Respiratory Distress Potential Portable Individual Biocontainment Unit to Reduce COVID-19 Transmission Protein Produced in Sepsis Lowers Blood Pressure, Treatment Identified to Reverse Effects Breakthrough Discovery in HIV Research Opens Path to New, Better Therapies Researchers Identify Cells Likely Targeted by COVID-19 Virus Adult Astrocytes Are Key to Learning and Memory Medical Devices Lab Technology May Help COVID-19 Patients The Future of Human Healing May Lay in the Brain of a Starfish Turning On the 'Off Switch' in Cancer Cells Mysterious Tuft Cells Found to Play Role in Pancreatitis Male-Female Cardiac Repair Differences in Heart Failure Survival After Heart Attack UPMC-Led Global Effort Fast Tracks Testing of COVID-19 Therapies Exercise Restores Youthful Properties to Muscle Stem Cells of Old Mice Predicting the Evolution of Genetic Mutations Researchers Describe Possible Mechanism for Link Between Obesity and Breast Cancer Tailoring Treatment for Triple-Negative Breast Cancer Off-The-Shelf Artificial Cardiac Patch Repairs Heart Attack Damage in Rats, Pigs Engineered Virus Might Be Able to Block Coronavirus Infections, Mouse Study Shows COVID-19 Vaccine Candidate Shows Promise UPMC Close to Immunity Test that Could Help End COVID-19 Lockdown Lets Do the Twist Uncovering Stimulations Impact on Neurons Push for Artificial Intelligence Innovation in Medical Imaging Project Wins University of Pittsburgh Scaling Grant Dr. Jelena Janjic Helps Lead Nanomedicine Effort in Transplantation NeuBase Therapeutics Announces Positive, Preclinical Data Validating its Novel Genetic Therapy PATrOL Platform Cancer Scientists Aim to Use Protein Power to Stop Tumor Growth Compound in Fruit Peels Halts Damage and Spurs Neuronal Repair in Multiple Sclerosis Evaluating Grip Strength to Identify Early Diabetes Chilling Concussed Cells Shows Promise for Full Recovery Muscle Protein Abundant in the Heart Plays Key Role in Blood Clotting During Heart Attack Starving Pancreatic Cancer of Cysteine May Kill Tumor Cells Old Human Cells Rejuvenated with Stem Cell Technology Researchers Find Way to Improve Cancer Outcomes by Examining Patients' Genes Blood Test Detects Over 50 Types of Cancer, Some Before Symptoms Appear Mechanisms to Prevent Crohn's Disease Unveiled Crumpled Graphene Makes Ultra-Sensitive Cancer DNA Detector New Coronavirus Stable for Hours on Surfaces Engineers Model Mutations Causing Drug Resistance Immunotherapy Using 'Young Cells' Offers Promising Option Against Cancer AI May Help Predict Responses to Non-Small Cell Lung Cancer Systemic Therapies Melanoma Is Killing Fewest Americans in Decades How Skin Cells Prepare to Heal Wounds Removing Belly Fat Before It Sticks to You Microbial DNA in Patient Blood May Be Tell-Tale Sign of Cancer Mimicking Cancer to Avoid Transplant Rejection Developing a Valve for Developing Hearts Intralipid Improves Efficacy of Chemotherapy Treatment Coronavirus Spreads Quickly and Sometimes Before People Have Symptoms, Study Finds How Stem Cells Repair Damage from Heart Attacks Researchers Stop Blood Vessel, Tumor Growth in Mice Gene Therapy Reverses Heart Failure in Mouse Model of Barth Syndrome New Method to Grow Human Blood Vessels DARPA Awards $22M for Smart Device that Regenerates Muscle The Ever-Changing Landscape of the Eye 'Primitive' Stem Cells Shown to Regenerate Blood Vessels in the Eye Researchers Discover New Stem Cells That Can Generate New Bone Two-Faced Bacteria Tiny Scorpion-Derived Proteins Deliver Arthritis Drugs to Joints in Preclinical Study 'It's Like You Have A Hand Again': An Ultra-Precise Mind-Controlled Prosthetic UPMC Celebrates 500th Adult Living-Donor Liver Transplant Dr. Bryan Brown Featured in the Products of Pittsburgh Podcast Inhalation Therapy Shows Promise Against Pulmonary Fibrosis in Mice, Rats COVID-19: A Reminder of the Challenge of Emerging Infectious Diseases Even Damaged Livers Can Handle Life-Saving Medication Early Intervention Following Traumatic Brain Injury Reduces Epilepsy Risk Support for Female Pelvic Floor Research Alcohol in Her Urine, But Not in Her Blood: Putting the Puzzle Pieces Together Dr. Anna Balazs: Shining a New Light on Biomimetic Materials Smoking Relapse Common in Weight-Loss Surgery Patients McGowan Institute Affiliated Faculty Participate in the 2020 Gordon Research Conference to Foster Collaborations in Neural Engineering Noninvasive, Self-Adhesive Sensor Predicted Worsening Heart Failure in Veterans Ulcerative Colitis Linked to Missing Gut Microbes Releasing Brakes: Potential New Methods for Duchenne Muscular Dystrophy Therapies Researchers ID Protein Function in Parasites that Cause Sometimes Fatal Diseases A Promising New Strategy to Help Broken Bones Heal Faster Artificial Intelligence Yields New Antibiotic New Method Gives Glaucoma Researchers Control Over Eye Pressure Dr. George Gittes Diabetes Gene Therapy Licensed to Genprex, Inc. Phase I Clinical Trial Next Step Dr. Cecelia Yates Receives CSL Behring and University City Science Center Funding Why Inclusivity Matters Bulk of Nurse Practitioners Work at Nursing Home Remains Nonclinical Researchers Look to Fungus to Shed Light on Cancer How the Brain's Immune System Could Be Harnessed to Improve Memory Human Gut-in-a-Dish Model Helps Define 'Leaky Gut,' and Outlines a Pathway to Treatment Finding a Cure for Dog's Brain Cancer May Help Us Find a Cure for Ourselves New Treatment Discovered for Rare Eye Disease May Prevent Blindness Novel Techniques for Mining Patented Gene Therapies Offer Promising Treatment Options Superior 'Bio-Ink' for 3D Printing Pioneered McGowan Institute Affiliated Faculty Members Receive CMI Project Funding Using Regenerative Biology to Restore Mucus Production PediaFlow Project Wins Cornells Scale-Up and Prototyping Award If Cancer Were Easy, Every Cell Would Do It Flickering Light Mobilizes Brain Chemistry That May Fight Alzheimer's Cells' Springy Coils Pump Bursts of RNA Gene Hunting: The Power of Precision Medicine Scientists Boost Gene-Editing Tools to New Heights in Human Stem Cells First-of-Its-Kind Technology Lights Up Lung Cancer Cells, Helps Improve Patient Outcomes Researchers Identify Opportunities to Advance Genomic Medicine Algae Shown to Improve Gastrointestinal Health Parkinson's Disease May Start Before Birth Mechanism for How Common Gene Therapy Vectors Enter Cells Liver Fibrosis 'Off Switch' Discovered in Mice Discovery Sheds New Light on How Cells Move Researchers Regrow Damaged Nerves with Polymer and Protein Vitamin D Linked to Better Blood Pressure in Pittsburgh Kids Pitt Researchers Propose Solutions for Networking Lag in Massive IoT Devices Rupture of Intracranial AneurysmsHow the Right Tools Help Find the Cause Sepsis Kills 1 in 5 Globally, Double Previous Estimate How Decisions Unfold in a Zebrafish Brain Cancer Study May Accidentally Help Researchers Create Usable Blood Stem Cells A Secreted Signature of Aging Cells New Vulnerability in Kidney Cancer Scientists Breach Brain Barriers to Attack Tumors UPMC First in the U.S. to Implant Wireless Retinal Device Dr. Fabrisia Ambrosio Named Co-PI on $3.8M R01 Grant Nerve-Healing Startup Renerva Joins McGovern Incubator Dr. Takashi Kozai Receives $1.6M NIH Award to Develop an Innovative Wireless Neural Device for Long-Term and Precise Stimulation Heart Transplants from Donors with Hepatitis C May Be Safe Abbott Gets FDA Approval for Less-Invasive Heart Pump Implant Procedure Salama Lab Study Reveals How Relaxin Targets Cardiovascular Disease Exosomes Promote Remarkable Recovery in Stroke Cancer Mortality Continues Steady Decline, Driven by Progress Against Lung Cancer Pathways that Extend Lifespan by 500 Percent Identified Finding a New Way to Fight Late-Stage Sepsis Delivering TB Vaccine Intravenously Dramatically Improves Potency Starting Point for Designing Drugs that Cure Clostridium Difficile Snake-Like Proteins Can Wrangle DNA Step Toward 'Ink' Development for 3-D Printing a Bioprosthetic Ovary Alzheimer 'Tau' Protein Far Surpasses Amyloid in Predicting Toll on Brain Tissue Hydrogels Control Inflammation to Help Healing Scientists Show How Tiny, Mutated Neuron Antennae Impair Brain Connectivity New CRISPR-Based System Targets Amplified Antibiotic-Resistant Genes Radiation Breaks Connections in the Brain Origins of Neurodegenerative Disease Bone Bandage Soaks Up Pro-Healing Biochemical to Accelerate Repair Mitochondria Are the 'Canary in the Coal Mine' for Cellular Stress BioHybrid Solutions Awarded $30M Contract by the US Dept. of Defense And the Beep Goes On: CMU/UPMC Collaborative Effort Unravels Medical Mysteries Dr. Dennis McNamara to Chair Clinical Steering Committee for Trial to Treat Acute Myocarditis Researchers Find New Role for Dopamine in Gene Transcription and Cell Proliferation Two Steps Forward, One Step Back: Dr. Stephen Badylak at TEDx Fairfield University Scientists Use Crabs to Validate Popular Method to Identify Unknown Human Brain Neurons Empowering Mucosal Healing with an Engineered Probiotic Nanocontainer Ships Titan-Size Gene Therapies and Drugs into Cells BPA Levels in Humans Dramatically Underestimated How the Strep Bacterium Hides from the Immune System Dynamics of Crucial Immune System Proteins Transition to Exhaustion: Clues for Cancer Immunotherapy New Strategies Against Bone Metastases from Prostate Cancer New Treatment for Brain Tumors Uses Electrospun Fiber Making Higher-Energy Light to Fight Cancer What Keeps Cells in Shape? New Research Points to Two Types of Motion Highly Sensitive Epigenomic Technology Combats Disease Locking Up Fats in CAGEs to Reduce Obesity Turning Key Metabolic Process Back on Could Make Sarcoma More Susceptible to Treatment Tendon Stem Cells Could Revolutionize Injury Recovery Science Underestimated Dangerous Effects of Sleep Deprivation Scientists Suggest New Solution to the Rare-Disease Problem Directional Control of Self-Propelled Protocells New Screening Method Identifies Inhibitors of Cancer Cell Metabolism Better Understanding of Soft Artificial Muscles How Fibrosis Progresses in the Human Lung Metastatic Breast Cancer Research Receives A Glimmer of Hope Foundation Funding Review Article Provides a Framework for Ongoing/Future Brain Tissue Healing Studies Metabolic Effects of an Oral Blood Cancer Drug At the Heart of Regeneration: Scientists Reveal a New Frontier in Cardiac Research Spray Painting Fiber Bandages Onto Wounds Biomarker Blood Test Could Reveal High Risk Heart Patients in Need of Treatment Specific Neurons that Map Memories Now Identified in the Human Brain Dr. Dobrawa Napierala Awarded Grant to Commemorate Soft Bones 10th Anniversary and Hypophosphatasia Awareness Day Dr. Tracy Cui Leads Pitt Neuron Research in Pitt/CMU Brain Collaboration Pitt Teams Replacement Heart Valve Could Decrease Need for Pediatric Surgeries Cocktail Proves Toxic to Leukemia Cells Complex Cellular Machine Visualized to Yield New Insights in Cancer Machine Learning Leads to Novel Way to Track Tremor Severity in Parkinson's Patients Mutated Form of DNA Repair Protein May Shed Light on Its Role in Preventing Cancer By Targeting Flu-Enabling Protein, Antibody May Protect Against Wide-Ranging Strains SPRY Clinical Trial Is First of Its Kind Re-Envisioning Ophthalmology New Drug-Delivery Technology Promises Efficient, Targeted Cancer Treatment Dementia Patients' Adult Kids Diagnosed Earlier than Their Parents DNA-Reeling Bacteria Yield New Insight on How Superbugs Acquire Drug-Resistance New CRISPR Genome Editing System Offers a Wide Range of Versatility in Human Cells Twin Study Shows What's Good for the Heart Is Good for the Brain Transient and Long-Term Disruption of Gut Microbes After Antibiotics Men with Breast Cancer Face High Mortality Rates In a First, Scientists Pinpoint Neural Activity's Role in Human Longevity DNA Fracturing Rewires Gene Control in Cancer How Mucus Tames Microbes Dementia Spreads Via Connected Brain Networks Scientists Help Immune System Find Hidden Cancer Cells 'Back in Time': Researchers Unravel Early Makings of an Exhausted T Cell Coffee Bean Extracts Alleviate Inflammation, Insulin Resistance in Mouse Cells Humans Have Salamander-Like Ability to Regrow Cartilage in Joints β-blockers Build Heart Muscle Manufacturing in Microgravity Improving Neural Implants NIH Grant: $21.5 million to Establish the LB3P MRC Revealed: How Tooth Enamel Is Strong Enough to Last a Lifetime McGowan Institute Teams Win Big at PInCH Applying Structural Monitoring Technology to the Human Spine NIH Grant: $1.5 Million to Study the Mechanism of Osteoarthritis Pain Project Receives Pitts Center for Medical Innovation Award in Round-1 2019 Pilot Funding Stem Cell Treatments for Shoulder and Elbow Injuries Flourish, But So Far There's Little Evidence They Work High-Fructose and High-Fat Diet Damages Liver Mitochondria A Brain Protein That Could Put the Brakes on Alzheimer's Molecular Basis of Vision Revealed Potential Nerve Repair Technology Receives NSF and NIH Funding The State of Cell-Based Therapies for Arthritis and Osteoporosis Dr. John Pollock Designs App to Improve Mental Health Potential Treatment of Metastatic Solid Tumors Receives Funding Boost US Pediatric Heart Transplant Waitlist Policy Change Falls Short of Intended Benefits How Fungal Biofilm Structure Impacts Lung Disease Probes Shed New Light on Alzheimer's Cause Long-Acting, Injectable, Multi-Drug Implant Shows Promise for HIV Prevention and Treatment Leukemia Drug Shows Promise for Treating a Childhood Brain Cancer Scientists Identify a Possible New Treatment for Diabetic Retinopathy Gene Therapy Reduces Obesity and Reverses Type 2 Diabetes in Mice Scientists Listed Ways of Applying Genetic Engineering to Treat Parkinson's Disease Transplanted Brain Stem Cells Survive Without Anti-Rejection Drugs in Mice Tiny Bubbles in Our Body Could Fight Cancer Better than Chemo How IL-6 Allows the Immune Response to Develop for a Key Cell, the T Follicular Helper Promising Treatment for an Incurable, Deadly Kidney Disease Gene Therapy Helps Functional Recovery After Stroke Strawberries May Be Key to Developing an Insulin Pill Dr. Eric Lagasse Work Highlighted in Forbes A Comprehensive Catalog of Human Digestive Tract Bacteria Discovery Paves the Way for Earlier Detection of Type 1 Disease Brain Waves Detected in Mini-Brains Grown in a Dish Study Suggests Transplanting Hep C-Infected Kidneys to Uninfected Donors Safe Scorpion Toxin that Targets 'Wasabi Receptor' May Help Solve Mystery of Chronic Pain Runaway Mitochondria Cause Telomere Damage in Cells Self-Rolling Sensors Take Heart Cell Readings in 3D 3D Printing of Soft Materials: New and Complicated Variables Dr. Youngjae Chun Receives American Heart Associations 2020 Innovative Project Award Tiny RNA Provides Big Protection After a Heart Attack Diverse Immune Cell Profiles and Roles Found in Breast Cancer Resistance to Immunotherapy Promising Approach to Reducing Plaque in Arteries Properties of Cells that Affect How Tissue Structures Form Quest for New Cancer Treatment Crosses Milestone K+ Channel Study Could Help Develop Drugs for Life-Threatening Conditions Oncologists Echo Findings that Suggest a Reduced Risk of Breast Cancer Recurrence New Lipid Signaling Target May Improve T Cell Immunotherapy Possible New Treatment Strategy for Lung Cancer Regulating Blood Supply to Limbs Improves Stroke Recovery New Molecule Could Help Improve Heart Attack Recovery Targeting Cell Division in Pancreatic Cancer Research Using Mechanics and Physics Could Predict Diseases that 'Stress Out' Cells Development of a Mantle Cell Lymphoma Cell Culture Model Study: Inflammation Persists in Sepsis Survivors Vorp Lab Using Amazon Web Services to Diagnose/Treat Abdominal Aortic Aneurysms A Leap Forward in Kidney Disease Research: Scientists Develop Breakthrough In Vitro Model Damaged Hearts Rewired with Nanotube Fibers New Target Found for Disease of the Heart's Smallest Blood Vessels Inherited Pancreatic Cancer Risk Mutation Identified Robotic Neck Brace Dramatically Improves Functions of ALS Patients Mapping the Structure of Protein Aggregate that Leads to Alzheimer's Researchers Identify Key Mechanism Linked to Neuropsychiatric Lupus An Alternate Theory for What Causes Alzheimer's Disease Researchers Find Proteins That Might Restore Damaged Sound-Detecting Cells in the Ear Scientists Can Now Manipulate Brain Cells Using Smartphone New Alliance with the International Space Station U.S. National Laboratory Pitt First to Grow Genetically Engineered Mini Livers in the Lab to Study Disease and Therapies 3D Printing the Human Heart A Wearable Device So Thin and Soft You Won't Even Notice It Model Predicts Cognitive Decline Due to Alzheimer's, Up to Two Years Out New Treatment Option Shown for Heart Failure Fluid Overload AI Could Enable Accurate Screening for Atrial Fibrillation Biologists and Mathematicians Team Up to Explore Tissue Folding Slowing Metabolic Rate Can Prevent Detrimental Effects of Genetic Mutations New Cause of Cell Aging Discovered HERL Receives $50K Grant from Disabled Veterans National Foundation Grant: Role of Extracellular Matrix in Age-Related Declines of Muscle Regeneration Key Gene Behind Hallmark of Lou Gehrig's Disease Identified Identity-Shifting Cells Protect Against Rupture in Atherosclerosis Two Therapeutic Targets Identified for Deadly Lung Cancer Motorized Prosthetic Arm Can Sense Touch, Move with Your Thoughts 'Limitless Potential' of Artificial Protein Ushers in New Era of 'Smart' Cell Therapies Molecular Sensor Scouts DNA Damage and Supervises Repair Pitt Receives $6 Million for Vision Restoration Research Encephalitis Identified as Rare Toxicity of Immunotherapy Treatment Epileptic Seizures Reduced in Mice After Removal of Newborn Neurons Genetic Similarities of Osteosarcoma Between Dogs and Children Discovering How Diabetes Leads to Vascular Disease Neuroscientists Discover Neuron Type that Acts as Brain's Metronome Researchers Wirelessly Hack 'Boss' Gene, A Step Toward Reprogramming the Human Genome Gene Linked to Severe Liver Damage ALung: Update on US and UK Clinical Trials First Ever State Sepsis Regulation Tied to Lower Death Rates Dr. Mangesh Kulkarni Receives $18K Award from Pitts Central Research Development Fund New Study Highlights Advantages of Living-Liver Donation MechMorpho Lab Brings Computation and Experimentation Closer Together DNA Replication Machinery Captured at Atom-Level Detail New Vaccine Strategy Boosts T-Cell Therapy Targeting a Key Protein May Keep Ovarian Cancer Cells from Spreading Patterns in DNA Reveal Hundreds of Unknown Protein Pairings Sheaths Drive Powerful New Artificial Muscles New Technology Improves Atrial Fibrillation Detection After Stroke Study Gives Insight into Sun-Induced DNA Damage and Cell Repair Tiny Change Has Big Effects, Reverses Prediabetes in Mice Discovery Reveals Prolific Ability of Schwann Cells to Generate Myelin Immune Cells Invade Aging Brains, Disrupt New Nerve Cell Formation Researchers Map Crystals to Advance Treatments for Stroke, Diabetes, Dementia The Costs of Cancer in 2015: 8.7 Million Years of Life and $94 Billion in Lost Earnings HIV Eliminated from the Genomes of Living Animals 'Can You Hear Me, Now?' A New Strategy 'Raises the Volume' of Gut-Body Communication Freeze Frame: Researchers Solve How Cells Unfold Proteins Pathway Discovered That Prevents Buildup of Alzheimer's Protein Urinary Tract and Other Infections May Trigger Different Kinds of Stroke Breakthrough in How Cells Link Together Has Implications in the Proliferation of Cancer New Therapy Targets Gut Bacteria to Prevent and Reverse Food Allergies First-Ever Successful Mind-Controlled Robotic Arm Without Brain Implants Dr. Freddie Fu Weighs In On Unproven Stem Cell Treatments Using Hep C Infected Organs in Heart Transplant Operations NSF Awards $500,000 to Pitt Researchers to Create Neuromorphic Vision System Mimicking Human Sight Creating Lungs "From Scratch" Dr. Krzysztof Matyjaszewski and Researchers Develop Semi-Liquid Metal Anode for Next-Generation Batteries Shedding Light on Black Box of Inpatient Opioid Use Dr. Anne Robertson Delivers Keynote Lecture at International Conference Preventive Drug Therapy May Increase Right-Sided Heart Failure Risk in Patients Who Receive Heart Devices Scientists Develop 'Mini-Brain' Model of Human Prion Disease Discovery Could Lead to Improved Therapies for Duchenne Muscular Dystrophy Low Vitamin K Levels Linked to Mobility Limitation and Disability in Older Adults 'Virtual Biopsy' Device to Detect Skin Tumors Cardiac Toxicity Risk Factors Identified with Relapsed Multiple Myeloma Therapy Viruses Found to Use Intricate 'Treadmill' to Move Cargo Across Bacterial Cells Hidden Brain Signals Behind Working Memory Gut Microbes Eat Our Medication Pitt and CMU Researchers Discover How the Brain Changes When Mastering a New Skill Rapid Fluid Removal Increases Death Risk in Kidney Patients In-Utero Surgery in Pittsburgh Region to Treat Spina Bifida Challenges of Pancreatic Cancer and Treatment Advances Startup Focuses on Developing Catalysts for Industry Scientists Remind Immune Cells Whose Side They Should Be On Unhealthy Gut Promotes Spread of Breast Cancer Tissue Engineering: The Big Picture on Growing Small Intestines Ultimate Destiny: How Undifferentiated Cells Commit to Their Biological Fate How Old Are Your Organs? To Scientists' Surprise, Organs Are a Mix of Young and Old Cells Intranasal Stem Cell Therapy Restores Smell in Mice Researchers Create Soft, Flexible Materials with Enhanced Properties Drs. Peter Rubin and Albert Donnenberg Bring Adipose Cell Therapy to Italy How Learning and Decision-Making Share a Common Underlying Brain Mechanism Could Gold Be the Key to Making Gene Therapy for HIV, Blood Disorders More Accessible? More Than a Protein Factory: A Role for Ribosomes in Regulating Human Gene Expression ALS Research Reveals New Treatment Approach How to Enhance or Suppress Memories Technology Better Than Tape Measure for Identifying Lymphedema Risk Pitt, CMU to Create an Autonomous Robotic Trauma Care System Following Injury, A New Approach Could Help Rebuild Muscle The New Wave of Brain-Computer Interface Technology Sedation, Paralysis Do Not Improve Survival of ICU Patients Big Data Reveals Hidden Subtypes of Sepsis TEDx: Dr. Jelena Janjic, When in Pain, Innovate! Road to Cell Death Mapped in the Alzheimer's Brain Protein that Hinders Advancement of Prostate Cancer Identified Scientists Use Molecular Tethers, Chemical 'Light Sabers' for Tissue Engineering Why Lack of Sleep Is Bad for Your Heart Electric Field-Based Dressing Helps Heal Wound Infections Natural Compound Found in Broccoli Reawakens the Function of Potent Tumor Suppressor Advancing Cell Therapy for Diabetes Direct Oxidative Stress Damage Shortens Telomeres FLARE IDE Study Results Published; FLASH Study Continues Researchers Receive a $2.5M NIH Award to Create an Improved Repair Device for POP Treatment Targets for Men with Advanced Prostate Cancers Bone Cells Suppress Cancer Metastases Rare Gene Mutations May Prevent Heart Disease Human Gut Microbiome Physiology Can Now Be Studied In Vitro Using Organ Chip Technology Room for Thought: Brain Region that Watches for Walls Identified Researchers Putting the Brakes on Lethal Childhood Cancer Drugs That Block CRISPR-Cas9 Genome Editing Identified Putting Vision Models to the Test Synthetic Biology Used to Target Cancer Cells While Sparing Healthy Tissue Link Between Starch Digestion Gene, Gut Bacteria Balazs Lab Team Replicate Feed, Fight and Flight Responses in Catalytic Chemical Reactions Beckman Coulters Early Sepsis Indicator Receives 510(k) Clearance from the U.S. FDA Zero Lift Patient Transfer and Repositioning System Biomarker for Chronic Fatigue Syndrome Fecal Transplants May Be Best Answer to Antibiotic-Resistant Bacteria Scientists Unlock New Role for Nervous System in Regeneration TET Proteins Regulate Factors Essential for Normal Antibody Production Pericytes May Improve Muscle Recovery An Army of Micro-Robots Can Wipe Out Dental Plaque Clinical Trials Moving Forward for ALung Technologies, Inc. Separating Stem Cell Therapy Hope vs. Hype: More from Dr. Peter Rubin Dr. Antonio DAmore Weighs In on First 3D Printed Heart Efforts Towards Human Performance Optimization Stimulation Remodels the Epileptic Brain to Prevent Seizures FDA Added Sugar Label Could Be a Cost-Effective Way to Improve Health, Generate Savings Turning Silenced Cancer Genes Back into Fighters Scanning for Cancer Treatment Antimicrobial Resistance Gene: New Gene Variant Is More Resistant to Hospital Antiseptic Drug Reduces Risk of Kidney Failure in People with Diabetes, Study Finds A Specific Gene Could Play a Major Role in Reducing Brain Swelling After Stroke Crucial 'Electrical Switch' in the Brain Electrostimulation Can Improve Working Memory in People Brain-Machine Interface Research Receives $12 Million from the NIH Study Shows Key Factors in Sustaining Weight Loss Following Bariatric Surgery Physical Therapists Play Key Roles in Innovative Rehabilitation Technologies Potential Treatment for Chronic Pain Getting Closer Progress Toward Epstein-Barr Virus Vaccine Single-Cell Sequencing Reveals Landscape of Immune Cell Subtypes in Lung Cancer Tumors Proton Therapy Shows Efficacy, Low Toxicity in Large Cohort of Children with High-Risk Neuroblastoma Ovarian Cancer Patients Undertested for Mutations that Could Guide Clinical Care Treatment Turns Tumors into Cancer Vaccine Factories Advances in Deep Brain Stimulation Could Lead to New Treatments How Immune Cells Help Tumors Escape Body's Defenses Wearable Sensors Mimic Skin to Help with Wound Healing Process Gut Microbiome Directs the Immune System to Fight Cancer Searching for Better Treatments for Irritated Tendons Largest Study of Childhood Cancer After IVF Researchers Discover the Source of New Neurons in Brain's Hippocampus A Surgical Option to Treat Chronic Pancreatitis Restoring this Enzyme's Function Protects Against Heart Disease in Lupus and Beyond Peptide Shows Promise for Protecting Kidneys from Nephritis Removal Of 'Zombie Cells' Alleviates Causes of Diabetes in Obese Mice Like Mountaineers, Nerves Need Expert Guidance to Find Their Way High-Fructose Corn Syrup Boosts Intestinal Tumor Growth in Mice Squishing Blood Stem Cells Could Facilitate Harvest for Transplants Video: Hope vs. Hype of Stem Cell Therapy Pure Omega-3 Prescription Drug Markedly Reduces First, Repeat and Total CV Events Key to Common Cancer Pathway New Research Identifies Potential PTSD Treatment Improvement The Story of GARP: A Potential Target for Cancer Immunotherapy Grow a Better Jawbone in Your Ribs Meningitis Changes Immune Cell Makeup in the Mouse Brain Lining Google Research Shows How AI Can Make Ophthalmologists More Effective With Single Gene Insertion, Blind Mice Regain Sight Uncovering Uncultivated Microbes in the Human Gut Extracellular Matrix: Communication Matters Moderate Muscle Strength May Lower Risk for Type 2 Diabetes Blood Holds Key to Liver Regeneration Could an Eye Doctor Diagnose Alzheimer's Before You Have Symptoms? Gene Identified that Increases Risk of Antibiotic Reaction Imaging Technique Finds Differences Between Radiation-Sensitive and Resistant Tumors Genomics Could Guide Pancreatic Cancer Treatment Harnessing the Power of the Lymph Node New Hope for Heart Transplants Targeting Deadly Tumors in Unborn Babies Penn Team Eradicates Hepatitis C in Nine Patients Following Lifesaving Heart Transplants from Infected Donors Promising Strategy to Fight the Most-Deadly Brain Tumor in Children Promising New Pancreatic Cancer Treatment Moves Forward First Genetic Clue for Elusive Pediatric Liver Disease Researchers 'Bait' Pathological Proteins Underlying Many Neurodegenerative Disorders Breakthrough Shines Light on Disease-Fighting Protein New Microfluidics Device Can Detect Cancer Cells in Blood Robust and Specific Gene Regulation Tool Developed for Primary Brain Neurons Young Bone Marrow Rejuvenates Aging Mouse Brains Pitt Bioengineers Create Ultra-Small, Light-Activated Electrode for Neural Stimulation Peripartum Cardiomyopathy Awareness Scientists See Dual-Layered Scaffolding of Cellular Nuclei DMD: Single CRISPR Treatment Provides Long-Term Benefits in Mice Advancing Therapy by Measuring the 'Games' Cancer Cells Play Drug Combination May Become New Standard Treatment for Advanced Kidney Cancer Drug to Rejuvenate Muscle Cells Brain Discovery Explains a Great Mystery of Alzheimer's, Parkinson's A New Mouse Model May Unlock the Secrets of Type I Diabetes More Efficient System to Reprogram Stem Cells With Age Comes Hearing Loss and a Greater Risk of Cognitive Decline Why Too Much DNA Repair Can Injure Tissue Uncovering the Evolution of the Brain How Breast Tissue Stiffening Promotes Breast Cancer Development Role of Estrogen in Controlling Type 2 Diabetes Obstructive Sleep Apnea Linked to Inflammation, Organ Dysfunction Researchers Find Trigger that Turns Strep Infections into Flesh-Eating Disease The Matrix Anti-Rejection Drug Could Be Repurposed to Treat Cancer HIV-1 Protein Suppresses Immune Response More Broadly than Thought Prediction Tool for Kidney Stones In Vitro Grafts Increase Blood Flow in Infarcted Rat Hearts Engineers Harvest Heart's Energy to Power Life-Saving Devices Opposite Effect: Protein Widely Known to Fight Tumors also Boosts Cancer Growth Three Novel Biomedical Projects Receive Center for Medical Innovation Awards Round-2 2018 Pilot Funding Muscle Memory Discovery Ends 'Use It or Lose It' Dogma New Therapeutic Target for Graft-Vs-Host Disease Could Make Bone Marrow Transplant Safer Investigational Monoclonal Antibody to Treat Ebola Is Safe in Adults Retinal Microenvironment in a Dish with Human Stem Cells New Technology Gives Unprecedented Look Inside Capillaries What You Eat Could Impact Your Brain and Memory Clinical Trial: Withdrawal of Immunosuppression in Living Donor Liver Transplantation Dr. Anna Balazs: Longtime Pitt Mentor, Engineer Works on the Future with Soft Robotics Shedding Light on Spinal Cord Injuries Energizing the Immune System to Eat Cancer Secret to Sepsis May Lie in Rare Cell New Nanoparticle Targets Tumor-Infiltrating Immune Cells, Flips Switch Targeting 'Hidden Pocket' for Treatment of Stroke and Seizure Epigenetic Change Causes Fruit Fly Babies to Inherit Diet-Induced Heart Disease Hindering Melanoma Metastasis with an FDA-Approved Drug Health Effects of Metabolic 'Magic Bullet' Protein Ultra-Sturdy Bones, with a Surprising Origin, Suggest New Osteoporosis Approach Powerful Microscope Captures First Image of Nanoscaffold that Promotes Cell Movement VISTA Checkpoint Implicated in Pancreatic Cancer Immunotherapy Resistance Stroke Drug May Also Prevent Alzheimer's Disease Brain Plasticity Restored in Adult Mice Through Targeting Specific Nerve Cell Connections Pennsylvania Pediatric Medical Device Consortium Changing Frequencies: Pitt Bioengineers Look Deeper into How Electrical Stimulation Activates Neurons A Catalytic Flying Carpet BYU Radio Hosts Interview with Dr. Stephen Badylak Essential Nutrient May Help Fight Alzheimer's Across Generations Stem Cell Signal Drives New Bone Building First-In-Human Trial of Senolytic Drugs Encouraging New Biomarker for Colorectal Cancers Identified Engineers Create an Inhalable Form of Messenger RNA Surprise Discovery Reveals Second Visual System in Mouse Cerebral Cortex Pitt-led Research Describes How Neurons Could Disconnect From Each Other in Huntingtons Disease Unravelling Mystery of How, When DNA Replicates Better Mouse Model Built to Enable Precision-Medicine Research for Alzheimer's Rerouting Nerves During Amputation Reduces Phantom Limb Pain Before It Starts 300 Blind Mice Uncover Genetic Causes of Eye Disease E-Bandage Generates Electricity, Speeds Wound Healing in Rats Dr. John Kellum Leads Study on Information from Urine Output in ICU Patients Technology Developed in Brown and Cheetham Laboratories Receives $2.4 Million DoD Award to Advance Its Peripheral Nerve Matrix Technology to the Clinic Study Funded to Enable Treatments for Chronic Inflammatory Demyelinating Polyneuropathy First Patient Dosed with VY-AADC Gene Therapy in Parkinsons Phase 2 Trial System Designed to Remove Large Clot Volume from Large Veins Enrolls First Clinical Patient Kumta Lab Work Receives Funding by DoD CDMRP Bradley Nindl, PhD, Delivers Keynote on Research Gut Microbiome Regulates the Intestinal Immune System Study Affirms Geographic Discrimination in Allocating Lungs for Transplant One Type of Brain Cell May Invite Alzheimer's Age-Related Immunity Loss In the Developing Brain, Scientists Find Roots of Neuropsychiatric Diseases Biologists Turn Eavesdropping Viruses into Bacterial Assassins Origins of Pain The Source of Stem Cells Points to Two Proteins Pushing Closer to a New Cancer-Fighting Strategy Shape-Shifting Cell Breakthrough Possible Connection Between Cardiovascular Disease and Living Near Oil and Gas Wells Unique Immune Cell Likely Drives Chronic Inflammation New Discoveries Predict Ability to Forecast Dementia from Single Molecule Innovative Approaches to Metabolic Disease The Self-Healing Heart One Researchers Path to Control a Machine with a Brain: Dr. Andrew Schwartzs Experience A Toxin that Travels from Stomach to Brain May Trigger Parkinsonism A Bacterial Protein Is Found to Promote Cancer Potential Arthritis Treatment Prevents Cartilage Breakdown Pitt Engineer-Clinician Team Uses Active Wrinkles to Keep Synthetic Grafts Clean Longevity Protein Rejuvenates Muscle Healing in Old Mice A Single Injection May Mean a Permanent Cure Benefits of Prehabilitation New 'Smart' Material with Potential Biomedical, Environmental Uses Eyes of Creutzfeldt-Jakob Disease Patients Show Evidence of Prions More Effective Hydrogel for Healing Wounds Widely Used Reference for the Human Genome Is Missing 300 Million Bits of DNA A Trojan Horse Delivery Method for miRNA-Enriched Extracellular Vesicles New Drug Discovery Could Halt Spread of Brain Cancer Study Finds That in Treating Obesity, One Size Does Not Fit All UPMC Hillman Cancer Center Scientists Receive $1 Million Grant for Breast Cancer Research First Results from Retinal Implant Clinical Trial Presented by UPMC Ophthalmology Expert Statins May Help Prevent Breast Cancer Metastasis Genetic 'Whodunnit' for Cancer Gene Solved Healing Kidneys with Nanotechnology Investigational Urate Elevation Does Not Appear to Raise Hypertension Risk Researchers Find New Pathway to Regulate Immune Response, Control Diseases Cancer Stem Cells Get Energy from Protein, and It's Proving to Be Their Achilles' Heel Synthetic Molecule Invades Double-Stranded DNA Leading Researchers Call for a Ban on Widely Used Insecticides Advance Stem Cell Therapy with Biodegradable Scaffold 'Master Key' Gene Has Links to Both ASD and Schizophrenia Chemical Synthesis Could Produce More Potent Antibiotics Evidence of Restored Vision in Rats Following Cell Transplant Genetic Risk Factor for CTE Detected Gut Microbiota of Infants Predicts Obesity in Children Breakthrough Test Screens for All Known Bacterial Infections Monitoring Electromagnetic Signals in the Brain with MRI Common Genetic Link in Lung Ailments Weight Regain After Bariatric Surgery Predicts Health Risks Device Could Help to Avoid Pipeline Disasters, Aid Glaucoma Patients Peptilogics Receives Regulatory Approval to Initiate First-in-Human Safety Study for Therapeutic Peptide PLG0206 Brain Computer Interface Researchers Receive $8 Million from NIH to Expand Groundbreaking Work Will a Patent Become a Product? New Way to Determine Whether Metastatic Cancer Cells in Breast Cancer Patients Are Dormant or Soon to Turn Deadly A Bad Influence: Interplay Between Tumor Cells and Immune Cells This RNA-Based Technique Could Make Gene Therapy More Effective Automated System Identifies Dense Tissue, A Risk Factor for Breast Cancer, in Mammograms New Immunotherapy Targeting Blood-Clotting Protein How Communication Among Cells Affects Development of Multicellular Tissue Study Points to Possible New Therapy for Hearing Loss Marker May Help Target Treatments for Crohn's Patients Treating Pre-Cavities Engineering Breast Milk to Treat Sick Infants Change in Transplant Rules Has Chance to Save Lives Novel Technology Enables Detection of Early-Stage Lung Cancer When Surgical Cure Still Is Possible There's a Better Way to Decipher DNA's Epigenetic Code to Identify Disease Nanoparticles to Treat Snakebites Aggressive Prostate and Lung Cancers Are Driven by Common Mechanisms, Researchers Find Analysis Reveals Genomic Effects of a New Cancer Treatment Now in Clinical Trials New Potential Treatment for One Type of Triple-Negative Breast Cancer HERL Receives VA Merit Review Grants PInCh 2018: What Is Your Idea to Improve Human Performance? Researchers Report on Promising Liver Cell Transplantation Technologies Aggressive Breast Cancer Cells Hijack Natural Stress Protector to Thrive Processed Meat Consumption Linked to Breast Cancer Risk Researchers Have Discovered How to Slow Aging Immune Cells Help Older Muscles Heal Like New Genetics of Cholesterol Point to Possible Drug Targets for Heart Disease, Diabetes Irreversible Damage to Color Vision Linked to Popular Erectile Dysfunction Drug CoreValve U.S. Pivotal High-Risk Trial: 5-Year Durability Data Studying Ferroptosis Manipulating the Skin with Microneedles to Fight Disease Technologies Developed in the Badylak Lab Licensed for Development New Drug Blocks Pancreatic Cancer Growth in Mice Study Finds New Cause of Brain Bleeds Identified Skin Wounds in Older Mice Are Less Likely to Scar Molecular Channel that Regulates Blood Pressure Described Cancer: Establishing Metastasis Drug OD Epidemic Has Been Growing Exponentially for Decades The First Demonstration of a Tissue Forming Through an Endogenous Process in the Brain FDA Awards Five Grants to Advance the Development of Pediatric Medical Devices IV Spas Promise Relief from Flu Symptoms, HangoversBut Are They Safe? MEBot Wheelchair Featured at VA Research Fair in Washington, DC Small Molecule Plays Big Role in Weaker Bones as We Age Zika Vaccine Shows Promise for Treating Deadly Brain Cancer Mapping Vast Unknown Territory of Long Non-Coding RNA Gene Therapy via Skin Protects Mice from Lethal Cocaine Doses Particles Surf Their Own Waves, Reveal How Microbes and Cells Move Through Human Body Brain's Lymphatic Vessels as New Avenue to Treat Multiple Sclerosis Class of Neurological Disorders Share 3D Genome Folding Pattern Integrated Clinical and Research Systems for Diabetic Foot Wound Care Finding that Links ALS/Ataxia to Cellular Stress Opens New Approaches for Treatment Scientists Block RNA Silencing Protein in Liver to Prevent Obesity and Diabetes in Mice Breakthrough Brain Research Could Yield New Treatments for Depression Building a Better Brain-In-A-Dish, Faster and Cheaper The Alchemy of Healing: Researchers Turn Open Wounds into Skin How Tissues and Organs Are Sculpted During Embryogenesis Plastic Surgeons Spread Word of the Danger of a Deadly Surgical Procedure Neutrophil Nanosponges Soak Up Proteins That Promote Rheumatoid Arthritis Mutations, Drugs Drive Cancer by Blurring Growth Signals Artificial Cells Are Tiny Bacteria Fighters CRISPR Halts Duchenne Muscular Dystrophy Progression in Pre-Clinical Studies Eating in 10-Hour Window Can Override Disease-Causing Genetic Defects, Nurture Health Scientists Identify Genetic Variants Almost Exclusive to African Americans That Predict Poor Outcomes in Dilated Cardiomyopathy Heart Disease Sucralose Produces Previously Unidentified Metabolites Diseased Heart Muscle Cells Have Abnormally Shortened Telomeres Epigenetic Reason for Drug Resistance Discovered in a Deadly Melanoma One Step Closer to Bioengineered Replacements for Vessels and Ducts Why Polluted Air May Be a Threat to Your Kidneys Improving Cell Replacement Therapy for Parkinson's Disease Two Molecules Offer Great Potential to Combat Cancer and Chronic Infections 'Liquid Biopsy' Predicts Lymphoma Therapy Success Within Days Progress Toward Plugging an Antibiotic Pump Knockdown and Replace: A Gene Therapy Twofer to Treat Blindness Biosensor Allows Real-Time Oxygen Monitoring For 'Organs-On-A-Chip' Taking the Brain Apart to Put It All Together Again Coal Miners at Growing Risk of Developing Debilitating, Deadly Lung Fibrosis When it Comes to Regrowing Tails, Neural Stem Cells Are the Key Platelet-Rich Plasma Does Not Promote Stem Cell-Mediated Cartilage Repair Integrated Sensor Could Monitor Brain Aneurysm Treatment Magnetic Gene in Fish May Someday Help Those with Epilepsy, Parkinson's Missing Immune Cells That Could Fight Lethal Brain Tumors First Study on Physical Properties of Giant Cancer Cells May Inform New Treatments Cannabis Link to Relieving Intestinal Inflammation Explained Dr. Kang Kim to Collaborate on National Kidney Foundation Award Dr. Joseph Glorioso Receives ACGT Grant in Support of a Cancer Vaccine for Melanoma Mapping the Inner Workings of a Living Cell More Sensitive Blood Test Diagnoses Heart Attacks Faster Solving Its Insolubility, Researchers Discover Method to Deliver Curcumin to Cancer Cells Striking A Balance Between Immunity and Inflammation Children Are Highly Vulnerable to Health Risks of a Changing Climate Eating Crickets Can Be Good for Your Gut, According to New Clinical Trial New Research Opens Door to Expanding Stem Cells Available for Transplants How to Make the Gene-Editing Tool CRISPR Work Even Better Engineering Team Designs Exoskeleton Technology to Help People Walk Again Heat Therapy Boosts Mitochondrial Function in Muscles Inflammation Inhibitor Delivered Directly to Kidneys Reverses Course of Destructive Nephritis Advancing the Search for Antibodies to Treat Alzheimer's Disease Magnetic Nanoparticles Deliver Chemotherapy to Difficult-to-Reach Spinal Tumors Preventing Dangerous Episodes of Low Blood Sugar with Diabetes: Study Provides Next Clue Microfluidic System Incorporates Neuroinflammation into 'Alzheimer's In A Dish' Model The Biomechanics Aspects of Cell Injections into the Brain Pediatric Sepsis Care Within an Hour Decreases Chance of Death, Largest Ever Analysis Finds Dr. Shilpa Sant Receives 7-year, $2.7 million NIH R37 Award to Develop Three-Dimensional Organoid Models of Breast Cancer Progression Dr. Takashi Kozai Receives $390K NIH Grant to Develop Imaging Technology That May Improve Brain Implant Design Dr. Kurt Weiss Receives Pitt Seed Grant Seeing a Brighter Future The microJoint: Potential to Revolutionize the Treatment of Conditions Related to Joint Complications Work of Badylak Lab Students Highlighted on Cover of Nature Review Materials Smart Bandages Designed to Monitor and Tailor Treatment for Chronic Wounds DNA Damage Links to Onset of Skin Cancer, Melanoma Mapped Creating Medicines Without Side Effects Natural Lipid Acts as Potent Anti-Inflammatory Scientists Identify Body's Microreactors for Innate Immunity Breast Cancer Growth Signals Are Enhanced by a Protein Outside Cells Pitts Center for Medical Innovation Awards Funding to Four Projects of McGowan Institute Affiliated Faculty Members Off/On Switch for DNA Repair Protein A Pretty Plant of Summer Produces a Promising Anti-Diabetes Compound Chronic Pain Remains the Same or Gets Better After Stopping Opioid Treatment Computer Algorithm Maps Cancer Resistance to Drugs, Therapy Your Brain with a Migraine: Effect of Electric Currents Stem Cells Restore Function in Primate Heart-Failure Study Fight-or-Flight Response Triggers White Bloods Cells, Increases Heart Attack Risk in People with Diabetes Fundamental Rule of Brain Plasticity Drug Compound Stops Cancer Cells from Spreading in Mice More Evidence for Controversial Theory that Herpesviruses Play Role in Alzheimer's Disease New Clues to Improving Chemotherapies 'Antifreeze' Molecules May Stop and Reverse Damage from Brain Injuries Our Intestinal Microbiome Influences Metabolism -- Through the Immune System Scientists Discover How Antiviral Gene Works New Target to Stop Cancer Growth Uncovered Comparing Risks and Costs for Biopsies in Women with Post-Menopausal Bleeding Physiologically Based Pharmacokinetic Model Predicts Changes in BUP Exposure at Different Stages of Pregnancy Restoring Identities With DBS Exploiting Cellular and Molecular Mechanisms of Neuroinflammation for New Treatments of Chronic Pain Device Attaches to Damaged Heart, Enabling Delivery of Multiple Therapy Doses Troves from a Search for New Biomarkers: Blood-Borne RNA 'Surgery in a Pill'A Potential Treatment for Diabetes New Target for Treating Heart Failure Regenerative Bandage Accelerates Healing in Diabetic Wounds Study: Most Concussion Patients Fall Under the Radar Team Approach to Support Families Improves ICU Patient-Centered Care and Lowers Costs Successful Vision Restoration to Strengthen with Modern Medicine Zebrafish Expose Tumor Pathway in Childhood Muscle Cancer Clinical Trials in a Dish: A Perspective on the Coming Revolution in Drug Development Putting Lungs Under Less Stress: Ultra-Protective Mechanical Ventilation Biomaterial Particles Educate Immune System to Accept Transplanted Islets Computer Simulations Identify Chemical Key to Diabetes Drug Alternatives HIV Vaccine Elicits Antibodies in Animals that Neutralize Dozens of HIV Strains New Approach to Immunotherapy Leads to Complete Response in Breast Cancer Patient Unresponsive to Other Treatments Dr. Stephen Badylak at the World Advanced Therapies & Regenerative Medicine Congress Infection Blood Test of Limited Value in Reducing Antibiotic Use New $30 Million Venture Capital Fund to Spur Innovation in Heart Disease and Stroke Care Insight to the Eye Lens Dr. Jessie VanSwearingen: Aging and Fall Prevention A Single-Injection Vaccine for the Polio Virus Chemists Synthesize Millions of Proteins Not Found in Nature New Data Changes the Way Scientists Explain How Cancer Tumors Develop The Vessel Not Taken: Understanding Disproportionate Blood Flow Mice Regrow Brain Tissue After Stroke with Bioengineered Gel Immune Cells Hold Promise in Slowing Down ALS New 3D Printer Can Create Complex Biological Tissues How Can We Help Children with Brain Injuries Transition Back to School? Heart Disease Severity May Depend on Nitric Oxide Levels Deadly Cancers Show Early, Detectable Differences from Benign Tumors Using MRSA's Strength Against It Scientists Find Missing Factor in Gene Activation From Technology Developed at the McGowan Institute, LyGenesis Closes $3 Million Series A Financing to Advance Its Organ Regeneration Technology to the Clinic Heartbeat Out of Sync Lifestyle Impacts Health EVLP: Expand the Donor Pool and Lead to Better Transplant Outcomes Living Donor Liver Transplant: A Lifesaving Option for All Patients with Liver Failure Malaria Parasite Accumulates Undetected in Bone Marrow Prolonged Exposure to Air Pollution Leads to Genetic Changes in Rat Brains, Study Finds AI Detects Patterns of Gut Microbes for Cholera Risk Uncovering a Hidden Protein 'Tail' that Puts the Brakes on Cell Signaling New Breakthrough Paving the Way for Universal Ebola Therapeutic Amplification of Key Cellular Organizer May Initiate Cancer LifeX Health Solutions Platform Opens Headquarters Announces $2 Million Henry L. Hillman Foundation Grant Pill for Breast Cancer Diagnosis May Outperform Mammograms New Models Could Uncover Important Answers for Alzheimer's Researchers Researcher Discovers Mechanisms and Epigenetic Markers with Implications for Diseases Ranging from Cancers to Infertility Using Mathematical Modeling and Evolutionary Principles Important in Treatment Decisions Butterfly Wings Inspire Light-Manipulating Surface for Medical Implants Editing Brain Activity with Holography Bacteria's Appetite May Be Key to Cleaning Up Antibiotic Contamination T Cell Biomarker Predicts Which CLL Patients Will Respond to CAR T Cell Therapy Diagnostic Imaging Computers Outperform Human Counterparts In Huntington's Disease, Heart Problems Reflect Broader Effects of Abnormal Protein Airborne Dust Threatens Human Health in Southwest Leading Genetics Study Method May Need Reconsideration, Significant Distortions Discovered What Can A Tasty Milkshake Teach Us About the Genetics of Heart Disease? Artificial Antimicrobial Peptides Could Help Overcome Drug-Resistant Bacteria Drug Reduces Size of Some Lung Cancer Tumors, Relapse Rate After Surgery Scientists Create Technology That Measures Tumors' Drug Resistance Up To 10 Times Faster Grafted Brain Organoids Provide Insight into Neurological Disorders Genetically Altered Broadly Neutralizing Antibodies Protect Monkeys From HIV-Like Virus Altered Immune Cells Clear Childhood Brain Tumor in Mice Researchers Chart A New Way to Look at Concussion Using AI to Detect Heart Disease From the Lab of Dr. Eric Lagasse to ABCs Greys Anatomy: Organogenesis of Ectopic Tissue in the Lymph Node Paralyzed Patient Feels Sensation Again An Advance for Precision Medicine Scientists Fix Genetic Risk Factor for Alzheimer's Disease in Human Brain Cells How Fat Tissue Shunts Energy to Tumors Machine Learning Finds Tumor Gene Variants and Sensitivity to Drugs in the Cancer Genome Atlas Dr. Jelena Janjic, Duquesne University Professor, Creates First Nanomedicine to Treat Pain Pitt Physicians Devise Emergency and Trauma Care Referral Map for U.S. 3-DIY: Printing Your Own Bioprinter New Trigger for Onset of Colon Cancer: May Lead to Better Therapies Even DNA That Doesn't Encode Genes Can Drive Cancer Uncovering A Mechanism Causing Chronic Graft-Vs-Host Disease After Bone Marrow Transplant Two-Pronged Approach Could Curb Many Cases of Lung Cancer New Technique Makes Heart Valve Replacement Safer for Some High-Risk Patients Yeast Engineered to Manufacture Complex Medicine Injectable Bandage Created Dietary Supplement Shows Promise for Reversing Cardiovascular Aging Lisfranc Injury: Causes and Treatment Options New Innovations in Cell-Free Biotechnology Bystander T Cells Can Steal the Show in Resolving Inflammation Novel Genomics Tool Enables More Accurate Identification of Rare Mutations in Cancer Cells Scientists Create Microscopic 'Swimmers' Controlled By a Magnetic Field Stem Cells Treat Macular Degeneration Modified Biomaterials Self-Assemble on Temperature Cues What Happens to a Dying Cell's Corpse? New Findings Illuminate an Old Problem Research Signals Arrival of a Complete Human Genome Scientists Caution That a Rare Childhood Liver Cancer Can Spread to The Brain Programming DNA to Deliver Cancer Drugs The Brain Is Less Flexible Than Previously Thought When Learning Producing Protein Nano-Armor Preventing Exhaustion in Immune Cells Boosts Immunotherapy in Mice Dr. John Pollock Develops Award-Winning App Safer Option to Saline for IV Bags Studied Lab Surprised to Find Its Drug-Delivery System Can Help Even Without Drugs Biophysicists Discover How Small Populations of Bacteria Survive Treatment Dr. Bradley Nindl: Military Career Leads to Success in the Lab and Beyond Dr. Shawn Kelly Receives Project Funding from the Chuck Noll Foundation International Consensus Meeting Led to Insight on Ankle Cartilage Treatments Survivors of Blood or Marrow Transplantation Are Likely to Experience Cognitive Impairment Stanford Researchers Develop Stretchable, Touch-Sensitive Electronics Novel Mechanism Linking Changes in Mitochondria to Cancer Cell Death Dealing with Diastasis Recti Study Suggests Way to Attack Deadly, Untreatable Nerve Tumors Clock Protein Controls Daily Cycle of Gene Expression by Regulating Chromosome Loops Chemist Designs Diabetic Treatment Minus Harmful Side Effects New Images Reveal How the Ear's Sensory Hairs Take Shape Liver Cells with Whole Genome Duplications Protect Against Cancer, Study Shows New Malleable 'Electronic Skin' Self-Healable, Recyclable Biomarker Predicts Success of Afib Treatment Blocking Action of Gene Enhancers Halts Spread of Tumor Cells Huntington's Disease Provides New Cancer Weapon New Technology Enables Identification of Biomarkers for a Wide Range of Diseases New Gordon Research Conference on Neuroelectronic Interfaces Co-Founded by Dr. Takashi Kozai A 3-D Approach to Stop Cancer in Its Tracks Pitt Researchers Look at Relaxin to Heal an Aging Heart Scientists Target Glioma Cancer Stem Cells, Which Could Improve Patient Survival Old Drug May Have New Tricks for Fighting Cancer Therapeutic Targets for Aggressive Triple-Negative Breast Cancers Gene Network That Regulates Motor Neuron Formation During Embryonic Development Eye and Heart Complications Are Tightly Linked in Type 1 Diabetes Study of How Brain Interprets Visual Cues Could Aid Treatment of Psychiatric Disorders Engineering a Functional Whole Organ for Transplantation Vascular Bypass Grafting: A Biomimetic Engineering Approach LifeX: To Deliver New Solutions to Tackle Prevalent and Intractable Global Diseases Uncovering the Early Origins of Huntington's Disease Study Suggests PD-1 Inhibitors Against Aggressive Pediatric Brain Cancer Subtype Body Clock Disruptions Occur Years Before Memory Loss in Alzheimers Silencing Is Golden: Scientists Image Molecules Vital for Gene Regulation Testosterone Holds Secret to Protect Women from Multiple Sclerosis Microbubbles Make Breast Cancer More Susceptible to Radiation Therapy Wearable Artificial Lung Designed to Help Sick Children Remain Mobile While Hospitalized McGowan Institute Affiliated Faculty Projects Receive Pitts Center for Medical Innovation Awards Round-2 2017 Pilot Funding Single Blood Test Screens for Eight Cancer Types Convergent Evolution of Gene Regulation in Humans and Mice A Centuries-Old Math Equation Used to Solve a Modern-Day Genetics Challenge Secrets of Longevity Protein Revealed in New Study T-Cells Engineered to Outsmart Tumors Induce Clinical Responses in Relapsed Hodgkin Lymphoma New Gene Variant Linked to Deadly Prostate Cancer Discovery Brings Stem Cell Therapy for Eye Disease Closer to the Clinic Uncovering the Power of Glial Cells Gene Therapy Reverses Autoimmune Diabetes in Mice Pitt Scientist Sets Sights on Gene Editing to Improve Vision Review Lays out Recommendations, Calls for Research to Improve Post-Hospitalization Sepsis Outcomes Pittsburgh Regional TV Highlights the McGowan Institute and Spin-Outs Dr. John Kellum Hails FDA Approval of Drug as a Major Advance in Treatment for Septic or Distributive Shock SHRS and Dr. Bradley Nindl Receive DOD Project Funding One Week. Two Authors. Two Journal Covers. Scientists Identify Mechanism of Impaired Dendritic Cell Function that Weakens Immune and Therapeutic Response to Cancer Video Game Improves Doctors Recognition and Triage of Severe Trauma Patients Pitt Team Receives NIH BRAIN Grant to Improve Prosthetics Through Sensory Feedback Improving Pediatric Transplant Outcomes High-Intensity Exercise Delays Parkinsons Progression SHRS and Dr. David Brienza Receive $5 Million Grant from National Institute on Disability/U.S. Department of Education SHRS and Dr. David Brienza Receive $5 Million Grant from National Institute on Disability/U.S. Department of Education Cellular Traffic Jam Seen in ALS/FTD -- Supports Drug Strategy Super-Silenced DNA Study Hints at New Ways to Reprogram Cells Monthly Brain Cycles Predict Seizures in Patients with Epilepsy Beta Blockers May Boost Immunotherapy, Help Melanoma Patients Live Longer Nanoscale Virus Modified to Deliver Peptide Drugs to Cells, Tissues A So-Called 'Muscle' Cancer Is Not Really a Muscle Cancer Improved Blood Stabilization Should Expand Use of Circulating Tumor Cell Profiling Throwing Molecular Wrench into Gene Control Machine Leads to 'Melting Away' of Leukemia Diabetic Blindness Caused and Reversed 'Trapped' Immune Cells in Rodent Retinas What Does Hair Loss Have to Teach Us About Cancer Metastasis? Tracking Effects of a Food Preservative on the Gut Microbiome Researchers Repurpose Immune-Activating Cytokine to Fight Breast Cancer Understanding Enzyme Cascades Key to Understanding Metabolism Direct Amygdala Stimulation Can Enhance Human Memory for a Day Skeletal Muscle Created from Stem Cells Dr. Bryan Browns Nerve Repair Technology Moves Forward Pitts Fall 2017 First Gear Cohort Honors Severe Burns Show Dramatic Healing After Being Sprayed with Patients Own Stem Cells Kidney Disease Increases Risk of Diabetes, Study Shows Possible Master Switch for Programming Cancer Immunotherapy New Assay May Help Predict Which Pancreatic Lesions May Become Cancerous Scientists Slow Progression of Fatal Form of Muscular Dystrophy Monkey Feel, Monkey Do: Microstimulation in Premotor Cortex Can Instruct Movement Viruses Share Genes with Organisms Across the Tree of Life, Study Finds New Player in Alzheimer's Disease Pathogenesis Identified Using a Mathematical Lens to Look at Disease as a Whole-Body Problem CRISPR-Carrying Nanoparticles Edit the Genome Cancer Immunotherapy Uses Melanin Against Melanoma Dr. Andrew Schwartz: For BCIs to Be Useful, Theyll Need to Be Wireless Florida Hospital for Children Partners with Childrens Hospital of Pittsburgh of UPMC to Develop Pediatric Liver Transplant Program in Florida Computer Program Helps Doctors Detect Acute Kidney Injury Earlier to Save Lives How Chronic Inflammation Tips the Balance of Immune Cells to Promote Liver Cancer First Mathematical Model That Predicts Immunotherapy Success Survival of the Least-Fit: Antiviral Drug Selectively Targets the Nastiest Viruses Nanoshells Could Deliver More Chemo with Fewer Side Effects Understanding Addiction in the Adolescent Mind Dr. Kia Washington to Direct National Eye Transplant Research Program Pitt and UPMC Researchers Collaborate to Save More Organs for Transplants Sight Unseen: Gene Expression Reveals 'Hidden' Variability in Cancer Cells' Response to Drugs For Older Adults with Diabetes, Losing Weight with Diet, Exercise Can Improve Circulation Discovery Challenges Belief About Brain's Cellular Makeup Focused Ultrasound Shows Promise for Treating Parkinson's Tremor Blocking Enzyme in Normal Cells May Impede Pancreatic Cancer, Team Shows Smart Artificial Beta Cells Could Lead to New Diabetes Treatment Using Networks to Understand Tissue-Specific Gene Regulation Brain's Response to Mid-Life Surge in Cell Aging Starts or Ends a Path to Dementia New Back Pain Study, Drug Take Back Efforts Could Lead to Decreased Opioid Use Tracing Cell Death Pathway Points to Drug Targets for Brain Damage, Kidney Injury, and Asthma An Engineers Guide to the Embryo Pitts Bioengineering's BodyExplorer Research Featured at First Annual ACC Smithsonian Creativity and Innovation Festival Cellular Biology UPMC Team Performs First U.S. LIVE Procedure to Stop Heart Failure Progression Protein Regulates Vitamin A Metabolic Pathways, Prevents Inflammation New Study Shows How Cells Can Be Led Down Non-Cancer Path New Asthma Biomarkers Identified from Lung Bacteria Diabetic Blindness: Protein That Plays Key Role Using Sound Waves for Biomedical Breakthroughs IBD: Synthetic Hydrogels Deliver Cells to Repair Intestinal Injuries Saving Hearts after Heart Attacks: Overexpression of a Gene Enhances Repair of Dead Muscle Flexible 'Skin' Can Help Robots, Prosthetics Perform Everyday Tasks by Sensing Shear Force Many Pelvic Tumors in Women May Have Common Origin: Fallopian Tubes Timing of Melanoma Diagnosis, Treatment Critical to Survival Scientists Identify Biomarker for Progression, Drug Response in Brain Cancer Scientists Demonstrate Path to Linking the Genome to Healthy Tissues, Disease ALung Receives IDE Approval to Conduct VENT-AVOID Trial of the Hemolung RAS for the US Market Dr. Marina Kameneva Receives U.S. Patent for DRP Work In Search of a Greener Cleaner New Model for Stroke Could Speed Discovery Tension Makes the Heart Grow Stronger Bone Marrow Concentrate Improves Joint Transplants Thinking 'Out-Of-The-Box' May Build a Better Brain and Prevent Dementia Prostaglandin EI Inhibits Leukemia Stem Cells Brain's Anterior Cingulate Cortex and Its Tie to Human Learning Mechanism That Underlies Age-Associated Bone Loss Dr. Shilpa Sant Named 2017 Young Innovator of Cellular and Molecular Bioengineering Pitt Receives NIH Grant to Develop 3-D Tissue Chips that Mimic Human Joints Pitt Researcher Receives NIH Funding Aimed at Preventing Bed Sores Findings About Immune System Could Stop Allergic Skin Reactions at the Cellular Source Sugary Secrets of a Cancer-Related Protein Natural Molecule Appears to Shut Off Cancer Cells' Energy Source Skin Patch Dissolves 'Love Handles' in Mice Engineered Therapy for Blood Clotting Disorder Shows Early Promise Sorting Molecules with DNA Robots Scientists Find Potential Mechanism for Deadly, Sepsis-Induced Secondary Infection Critical Molecular Link Between Inflammation and Diabetes Identified Researchers Identify Potential Biomarkers of Age-Related Macular Degeneration Eye Changes May Signal Frontotemporal Lobe Degeneration Scientists Construct First Predictive Model of Inflammatory Bowel Disease Research Identifies Causes and Possible Treatments for Deadly Diseases Affecting Children DNA Looping Architecture May Lead to Opportunities to Treat Brain Tumors Better Understanding of 'One of the Most Complex Organs' for Better Lung Treatments Modeling Particle Movements on Bees and Bacteria Could Lead to Robotics Advances Diabetes and Heart Disease Linked by Genes, Reveals Study Zika Virus Kills Brain Cancer Stem Cells Mysterious Protein-Folding Molecule Could Trigger Metabolic Disorders Adipose Tissue May Affect Cancer Development in Multiple Ways Genes Fueling Neuroblastoma Spread Now Identified Drug May Curb Female Infertility from Cancer Treatments Unraveling Alzheimers: New Study Documents How Brain Cells Go Bad Building a Pump Without Parts An Eye Towards Islets Pitt Researchers Awarded Funding in Neuroscience Research Grants Medical Implants and Aging Implanted Neural Stem Cells Grow Slow and Steady Boosting Immune Cell Memory to Improve Vaccines and Cancer Immunotherapy Bone Marrow Protein May Be Target for Improving Stem Cell Transplants Reducing Inflammation Without Lowering Cholesterol Cuts Risk of Cardiovascular Events Regenerative Potential of Cells in Mouse Retina Sending the Right Signals Drs. Prashant Kumta and Robert Kormos and CardioSense Receive Funding from Coulter@Pitt TPII Program Dr. Julie Phillippi Receives 5-year, $1.9 Million NIH R01 Award Pitts Center for Medical Innovation Awards Round-1 2017 Pilot Funding Computer Models Provide New Understanding of Sickle Cell Disease New Tool to Distinguish Between Viral, Bacterial Infections Newly Discovered Biomarkers May Lead to Promising Diagnostic Tool for Alzheimer's Lutein, Found in Leafy Greens, May Counter Cognitive Aging Creating Self-Recognizing and Self-Regulating Synthetic Materials Wearable Artificial Lung to Deliver Greater Mobility to Patients Ingestible Drug-Delivery Materials May Help Patients Comply with Treatment Regimens New Brain Death Pathway in Alzheimer's Disease Engineers Invent the First Bio-Compatible, Ion Current Battery Genome Editing with CRISPR-Cas9 Prevents Angiogenesis of the Retina Pitt School of Medicine Signs Collaborative Agreement with World-Renowned French Research Institutions Lecture: Dr. Marc Simon, Lead Investigator, Phase 2 Study in Patients with Pulmonary Hypertension Working the [Immune] System NIH Continues Pitts Cardiovascular Bioengineering Training Program Nanoscale Forces Measured in Aortic Smooth Muscle Cells Tell Story of Disease Comparing Algorithms That Search for Cancer Mutations New Tools Help Surgeons Find Liver Tumors, Not Nick Blood Vessels Many New Genetic Markers for Lupus Identified in Large Multi-Ethnic Study Toddler Brain Development: Bacterial Clues Found in Dirty Baby Diapers Promising Target to Protect Bone in Patients with Diabetes New Discovery Holds Potential for Treating Tuberculosis Neurodegenerative Diseases: A Biophysical Smoking Gun Traumatic Brain Injury in Veterans: Differences from Civilians May Affect Long-Term Care Tumor-Targeting MRI Contrast Developed, Based on Human Protein Former Badylak Lab Member Now Director of Preclinical Development at PECA Labs, Inc. Brain's Immune Cells May Drive Overeating and Weight Gain Repurposed Asthma Drug Shows Blood Sugar Improvement Among Some Diabetics Connection Between Autophagy and Lifespan: Scientists Take a Deeper Dive into Cellular Trash Personal Neoantigen Vaccine Prompts Strong Anti-Tumor Response in Patients, Study Shows Investigating Folding Stability and Dynamics of Proteins Phase 1 Clinical Trial for the Treatment of Severe Neurological Diseases Begins Earliest Molecular Events Leading to Organ Rejection Identified in Mice University of Pittsburghs Patent Record Broken 2 Years in a Row Shining Light on Brain Cells that Coordinate Movement Readily Available Drug Cocktail Can Help Prevent Sepsis Shock and Death New Tool to Identify and Control Neurons Where Are the New Therapies for Heart Disease? Brains Evolved to Need Exercise Insomnia Medication May Wake Up Some Patients from Vegetative State Chatter in the Deep Brain Spurs Empathy in Pre-Clinical Trials DRPs May Improve Cancer-Specific Outcomes in the Liver DNA Sent on Sequential, and Consequential, Building Mission Study Casts Doubt About Link Between Eczema, Cardiovascular Disease Hi-Res View of Protein Complex Shows How It Breaks Up Protein Tangles Gut Bacteria Might One Day Help Slow Down Aging Process New Antibiotic Effective Against Drug-Resistant Bacteria Mutations That Allow Bird Flu Strain to Spread Among Humans Identified Plant Compound More Powerful Than AZT Against HIV Use of Prefabricated Blood Vessels May Revolutionize Root Canals How Blows to the Head Cause Numerous Small Swellings Along the Length of Neuronal Axons Drug Lowers Levels of Biomarker Linked to ALS Study Identifies Potential Biomarker for Alzheimer's Disease Technology Unlocks Mold Genomes for New Drugs Researchers Identify Inhibitor That Overcomes Drug Resistance in Prostate Cancer Cellular Sweet Spot Found in Skin-Cancer Battle Western Diet Increases Alzheimer's Pathology in Genetically Predisposed Mice Animal Models Can't 'Tune Out' Stimuli, Mimicking Sensory Hypersensitivity in Humans New Cancer Drug Tested in Mice May Benefit Certain Leukemia Patients Low Levels of Vitamin A May Fuel TB Risk Key Feature for Modeling How Cells Spread in Fibrous Environments Injured Bones Reconstructed by Gene and Stem Cell Therapies Dr. Stephen Badylak Participates in World Science Festival Journal of Surgical Research Features Work of Dr. William Wagner 1 in 5 Surgical Weight-loss Patients Take Prescription Opioids 7 Years After Surgery Musculoskeletal Transplant Foundation Awards Funding for Novel Craniomaxillofacial Bone Regeneration Project Pitt Professor and Leader of International Sepsis Research Reacts to Global Sepsis Resolution Researchers Discover Mechanism That Controls Bone Formation, Function Remembrance of Things Past: Bacterial Memory of Gut Inflammation Stem Cells Yield Nature's Blueprint for Body's Vasculature Mind-Controlled Device Helps Stroke Patients Retrain Brains to Move Paralyzed Hands Genes Responsible for Severe Congenital Heart Disease Identified by Pitt Researchers Can Omega-3 Help Prevent Alzheimer's Disease? Brain SPECT Imaging Shows Possible Link Antibody for Fighting Cancer Emerges Brain Blood Vessel Lesions Tied to Intestinal Bacteria Blood Discovery Could Benefit Preemies, Help End Platelet Shortages Storing a Memory Involves Distant Parts of the Brain Precision Medicine Improves Treatment Outcomes for Some Pancreatic Cancer Patients Stem-Cell Transplants Show Limited Benefit for Double-Hit Lymphoma Patients in Remission New Gene Identified in Lou Gehrig's Disease New Finding Affecting Immune Reconstitution Related to B Cells Gut Microbiome May Predict Response to Biologic Therapy for Inflammatory Bowel Disease First 'Nanotherapeutics' Delivered to a Tumor New Blood Test Is More Accurate in Predicting Prostate Cancer Risk Than PSA Traumatic Brain Injuries May Be Helped with Drug Used to Treat Bipolar Disorder Kidney Research Leads to Surprising Discovery About How the Heart Forms Poor Overall Environmental Quality Linked to Elevated Cancer Rates Cancer Cells Shown to Co-Opt DNA 'Repair Crew' Modified Insulin and Red Blood Cells Used to Regulate Blood Sugar Neuronal Targets to Restore Movement in Parkinson's Disease Model Platelets Suppress T Cell Immunity Against Cancer Fixing Broken Hearts Through Tissue Engineering Novel Gene Editing Approach to Cancer Treatment Shows Promise in Pre-Clinical Tests New Line of Attack on Spinal Muscular Atrophy Mice with Missing Lipid-Modifying Enzyme Heal Better after Heart Attack Combination Therapy Could Provide New Treatment Option for Ovarian Cancer New Insight into Powerful Inflammatory Regulator A Transplant and a Cure: Research Team Eradicates Hepatitis C in 10 Patients Following Lifesaving Transplants from Infected Donors Bacterial metabolism affects the C. elegans response to cancer chemotherapeutics ALung Submits IDE Application to FDA Seeking Approval to Conduct Pivotal Study of the Hemolung RAS Studying a Catalyst for Blood Cancers Lyme Disease Researchers Seek Consensus as Number of Cases Grows Discovery Offers New Hope to Repair Spinal Cord Injuries Using CRISPR to Reverse Retinitis Pigmentosa and Restore Visual Function Skin Stem Cells Used to Generate New Brain Cells Does the Microbiome Play a Role in the Effectiveness of Colorectal Cancer Treatment? Implanted Scaffold with T Cells Rapidly Shrinks Tumors Protein Primes Mouse Stem Cells to Quickly Repair Injury, Study Finds Motor Neurons Adjust to Control Tasks, New Brain Research Reveals Dr. Anna Balazs to Lead DOD MURI Program Project McGowan Institute Spin-Out Company Closes $36 Million Financing Rapid Screening Machine Can Read and Separate Protein Sequences Cytokine Controls Immune Cells That Trigger Inflammatory Bowel Disease, Study Finds Scientists Combine a Peptide with a Nano Cancer Drug Formulation to Improve Treatment Effectiveness and Prevent Metastasis in Pancreatic Cancer Researchers Successfully Prevent Graft-Versus-Host Disease 2017 Gordon Research Seminar on Elastin, Elastic Fibers & Microfibrils Wheelchair Powered by Compressed Air, Designed by University of Pittsburgh Time-Lapse Video Reveals Cells Essential for 'Birth' of Blood Stem Cells Newfound Signal Helps Pancreatic Cancer Cells Hide from Immune System Pitt-Developed Artificial Lung Shows Promise in Pre-Clinical Trials Blood Vessels and the Immune System Talk to Each Other Screening the Dark Genome for Disease Technology to Screen Embryos Before Implantation Falls Short How Melanoma Tumors Form Stretching the Boundaries of Neural Implants Helping the Retina Regenerate Genetic Errors Associated with Heart Health May Guide Drug Development US Burden of Neurological Disease Is Nearly $800 Billion/Year Physician Judgment as Good as Complex Protocol for Sepsis Finds Seven-Country Collaboration Interaction Among Proteins that Cause Cancer Cells to Metastasize Scientist Pioneers New Technology, Maps Giant Virus Rogue Breast Tumor Proteins Point to Potential Drug Therapies Protein that Regulates Brain Cell Connections Could Be New Target for Treating Alzheimer's Disease Chemists Create Microscopic Environment to Study Cancer Cell Growth Systems-based analysis of RIG-I-dependent signalling identifies KHSRP as an inhibitor of RIG-I receptor activation NSF Award to Develop Ultrasonic Sensors for a Hybrid Exoskeleton Received Funding to Establish NIDCR Consortium for Tissue Regeneration Therapies Received from NIH Untreated Sleep Apnea in Children Can Harm Brain Cells Tied to Cognition and Mood Osteoporosis Drug Found Safe in Long-Term Trial Researchers Review Progress of Treating Glutamate Signaling in Depression Drosophila Effectively Models Human Genes Responsible for Genetic Kidney Diseases Autism: New Analysis Method of Metabolites Accurately Predicts Whether a Child Has Autism Dietary Anti-Cancer Compound May Work by Influence on Cellular Genetics Genetic Association with Aggressive Prostate Cancer Discovered New Drug Delivery Method for Cancer Therapy Developed Electroacupuncture Releases Stem Cells to Relieve Pain, Promote Tissue Repair, Study Finds Fat Cells Step In to Help Liver During Fasting First Steps in Human DNA Replication Dance Captured at Atomic Resolution Unproven Stem Cell 'Therapy' Blinds Three Patients at Florida Clinic Research Could Lead to Better Vaccines and New Antivirals Molecule Stops Fatal Pediatric Brain Tumor Lack of Oxygen, Not Excessive Stimulation, Cause for Half of Seizure-Related Brain Damage in Epilepsy New Structural Studies Reveal Workings of a Molecular Pump That Ejects Cancer Drugs Decoding the Genome's Cryptic Language Novel 'Barcode' Tracking of T Cells in Immunotherapy Patients Identifies Likely Cancer-Killers Antibiotics Used to Treat Cystic Fibrosis Increases Risk of Permanent Hearing Loss Diamonds That Deliver Dietary Prebiotics Improve Sleep, Buffer Impacts of Stress, Says Study McGowan Institute for Regenerative Medicine Holds Its Annual Scientific Retreat Catalytic Conveyor Belt Study Shows Strong Long-Term Survival Rates for Patients with GIST From Mice, Clues to Microbiome's Influence on Metabolic Disease Low Level Vitamin D During Remission Contributes to Relapse in Ulcerative Colitis Patients Second Cause of Hidden Hearing Loss Identified Immune Cell Serves As an Essential Communications Link for Migrating Cells Vitamin B3 Prevents Glaucoma in Laboratory Mice Scientists Monitor Crosstalk Between Intestinal Microbes and Immune System Food Additive Found in Candy, Gum Could Alter Digestive Cell Structure and Function Regenerative Medicine for Whole Organ Replacement Meditation and Mindfulness Practices: Heart Patients Treatment Plan Options Luminescence Switchable Carbon Nanodots Follow Intracellular Trafficking and Drug Delivery Understanding Enzymes: New Tool Can Help Researchers Identify Enzymes, and Their Abundance, in Microbiomes Neurons Support Cancer Growth Throughout the Body 'Achilles' Heel' of Key Anti-Cancer Protein Drug Could Prevent Infertility in Cancer Patients Cellular Quality Control Process Could Be Huntington's Disease Drug Target Routinely Prescribed Antibiotic May Not Be Best for Treating Severe C. Diff Infections Atomic-Scale View of Bacterial Proteins Offers Path to New Tuberculosis Drugs Cancer Drug Could Promote Regeneration of Heart Tissue Missing Link for Fighting Viral Pneumonia Identified Unhealthy Gut Microbes a Cause of Hypertension, Researchers Find Gene Therapy Restores Hearing in Deaf Mice, Down to a Whisper Molecular Medicine Features Work of McGowan Institute Affiliated Faculty Members Stem Cell Secretions May Protect Against Glaucoma Artificial Intelligence Uncovers New Insight into Biophysics of Cancer Research Suggests Way to Improve Stroke Treatments Examining Women's Bones During Menopause May Help Head Off Fractures Medical Milestone: 2000 Lung Transplants Microscopic Submarines for Your Stomach New Treatment Recommendations for a High-Risk Pediatric Leukemia Scientists Get Best View Yet of Cancer-Causing Virus HPV Noninvasive Ultrasound Pulses Used to Precisely Tweak Rat Brain Activity Nutritional Considerations for Healthy Aging, Reduction in Age-Related Chronic Disease Cervical Cancer Mortality Rates May Be Underestimated Scientists Reprogram Embryonic Stem Cells to Expand Their Potential Cell Fates Markers for Prostate Cancer Death Can Identify Men in Need of More Aggressive Treatment Melanoma Mutation Likes Fat for Fuel Scientists Identify Protein Central to Immune Response Against Tuberculosis Bacteria New Technology Enables 5-D Imaging in Live Animals, Humans Pitts Center for Medical Innovation Awards Four Novel Biomedical Devices Award: Ambulatory Assist Lung for Children Study Finds Patterns of Biomarkers Predict How Well People Age, Risks of Age-Related Disease Study Characterizes Key Molecular Tool in DNA Repair Enzymes Brain Protein Predicts Recovery Time Following Concussion Halting Lethal Childhood Leukemia Researchers Find Key Genetic Driver for Rare Type of Triple-Negative Breast Cancer Tailored Organoid May Help Unravel Immune Response Mystery University of Pittsburgh Cancer Institute Academy Expands Summer Scholar Program to Include College Students New Stem Cell Delivery Approach Regenerates Dental Pulp-Like Tissue in a Rodent Model DNA Markers Distinguish Between Harmless, Deadly Bacteria Long-Term Anti-Inflammatory Drug Use May Increase Cancer-Related Deaths for Certain Patients First Use of Graphene to Detect Cancer Cells Nanoparticle-Based Method Shows Promise in DNA Vaccine Delivery Discoveries from Largest Genome-Wide Study of Chronic Liver Disease Ancient Chinese Malaria Remedy Fights TB Oral Vaccine Against Salmonella Developed Understanding Why We Should Exercise New Study Shows Targeted Therapy Needed for Breast Cancer with Brain Metastases Researchers Find Bacterial Protein That Boosts Insulin-Producing Cells in Zebrafish Aging Process Increases DNA Mutations in Important Type of Stem Cell Loss of ARID1A Protein Drives Onset, Progress of Colon Cancer Cholesterol-Fighting Drugs Lower Risk of Alzheimer's Disease Mystery Molecule Is a Key to Inhibiting Colon Cancer Rare Obesity Syndrome Therapeutic Target Identified Bacterial 'Sabotage' Handicaps Ability to Resolve Devastating Lung Inflammation in Cystic Fibrosis Breast Cancer Update: Sentinel Node Biopsy Guidelines Encourage 'Less Is More' Approach How Do You Mend a Broken Heart? International Team Decodes Cellular Death Signals Tailoring of Protein Stability and Performance via Polymer-Based Protein Engineering Pitt Researchers Collaborate to Develop Lifesaving "Rescue Stent" Cancer Cells Hijack DNA Repair Networks to Stay Alive, Pitt Study Shows Preclinical Study: Using MRI to Monitor ECM Hydrogel in the Brain Post-Stroke Pitt to Lead Trauma Network, Up to $90M in Department of Defense-Funded Trauma Research Balancing Time and Space in the Brain: A New Model Holds Promise for Predicting Brain Dynamics Topical Therapy for Radiation-Induced Skin Damage Shows Promising Results $2.95 Million NIH Grant to Predict At-Risk Cerebral Aneurysms Received Pitt Researcher Part of Team That Discovered Way to Induce Visual Hallucinations Brown Lab Students Take 2nd Place in Michael G. Wells Student Healthcare Entrepreneurship Competition Concussions are Treatable, More Research Needed In a First, Pitt-UPMC Team Helps Paralyzed Man Feel Again Through a Mind-Controlled Robotic Arm Pitt-UPMC Neurosurgeon to Lead BRAIN Initiative Grant to Study How We Speak New Territory Analyzing DNA Modifications in Glioblastoma Young Blood Does Not Reverse Aging in Old Mice Investigators Pinpoint Cause, Possible Treatment for Rare Form of Sarcoma Structure of Human Astrovirus Could Lead to Antiviral Therapies, Vaccines History of Cells Told Through MEMOIR Antihypertensive Medications and Fracture Risk: Is There an Association? Plant Compounds May Boost Brain Function in Older Adults, Study Says Expression of Specific Gene Differentiates Moles from Melanoma New Topical Immunotherapy Effective Against Early Skin Cancer Common Probiotics Can Reduce Stress Levels, Lessen Anxiety Pitt Researchers Uncover Key Mechanisms of Cancer, Aging, and Inflammation Brain Needs to Be Retrained After ACL Injury Study Challenges Model of Alzheimer's Disease Progression Weight Loss After Obesity Doesnt Cut Risk of Certain Types of Cancer Research Connects First-Time Kidney Stone Formers and Chronic Kidney Disease Two Distinct Genetic Subtypes Found in Crohn's Disease Patients Regeneration of Spinal Nerve Cells Boosted New Non-Invasive Assay May Improve Surveillance of Heart and Other Solid-Organ Transplants New Molecule May Help Fight Obesity by Converting 'Bad' Fat to 'Good' Fat New Model for Understanding Myeloma Imaging with New Biomarker Tracks Tumor Progression, Response to Treatment for Common Brain Cancer Hypothyroidism Symptoms Linger Despite Medication Use, Normal Blood Tests Genome Engineering Paves Way for Sickle Cell Cure Dysfunction in Neuronal Transport Mechanism Linked to Alzheimer's Disease Common Prostate Cancer Treatment Linked to Later Dementia, Researcher Says Common Nerve Protein Elevated in Aggressive Neuroblastomas Calcium Supplements May Damage the Heart Mars-Bound Astronauts Face Chronic Dementia Risk from Galactic Cosmic Ray Exposure Brain Modulyzer Provides Interactive Window into the Brain New Study Finds 'Amplifier' Helps Make Connections in the Fetal Brain Major Racial Bias Found in Leading Genomics Databases Vaccinating Babies Without Vaccinating Babies Not Really a Matter of Choice? Acute infectious gastroenteritis potentiates a Crohn's disease pathobiont to fuel ongoing inflammation in the post-infectious period Grant Received from Hillman Foundation to Advance Brain Research Pitt Scientists Identify How Repair Protein Finds DNA Damage World-Renowned Expert in Research and Therapies for Blindness and Vision Impairment Joins McGowan Institute Preclinical Research: Potential Treatment of IBD Different Brain Atrophy Patterns May Explain Variability in Alzheimers Disease Symptoms Link Between Heart and Blood Cells in Early Development New Tool for Cancer Patients Measures the Stress of Expenses What's Really Going On in PTSD Brains? Experts Suggest New Theory Mystery of Bacteria's Antibiotic Resistance Unraveled Human Neurons Continue to Migrate After Birth Preliminary Zika Vaccines Prevent Neurological Disorders in Newborn Mice Pitt Team Receives $2.5 million in DOD Funds for First Retrievable Vascular Stent Wave of the Future: Micro Swimming Drone to Traverse the Human Body Using Sound Waves Researchers Receive NIH Grant to Develop Better Methodology to Treat Rotator Cuff Tears Abnormal Brain Protein May Contribute to Alzheimer's Disease Development Giant Thai Insect Reveals Clues to Human Heart Disease Key Players Responsible for Learning and Memory Formation Uncovered What Happens When the Brain Is Artificially Stimulated? Pediatric Atopic Dermatitis May Benefit from Early Immune Intervention Tattoo Therapy Could Ease Chronic Disease Immune and Targeted Therapies with Radiation Therapy Improves Outcomes for Melanoma Brain Metastases Patients, Say Researchers Fungus in Humans Identified for First Time as Key Factor in Crohn's Disease Activity Trackers Are Ineffective at Sustaining Weight Loss Stem Cells Grown into 3-D Lung-In-A-Dish Can Sertraline Prevent Depressive Disorders Following Traumatic Brain Injury? Molecular Switch Controlling Immune Suppression May Help Turn Up Immunotherapies Rare Genetic Condition May Provide Insights on Parkinsons and Other Late-Onset Diseases Abaloparatide Benefits a Wide Range of Postmenopausal Women with Osteoporosis Gut Pathogens Thrive on Body's Tissue-Repair Mechanism Industry/Pitt Partnership to Advance Additive Manufacturing Problem-Solving for Industry How Ionizing Radiation Damages DNA and Causes Cancer Case for Liquid Biopsies Builds in Advanced Lung Cancer Researchers Identify New Therapeutic Target for Cancer Six-Day Clinical Trial Finds Integrative Medicine Program Alters Blood Serum New Software Helps to Identify Course of Cancer Metastasis, Tumor 'Evolution' Using Light to Image and Potentially to Treat PTSD NIH Funds Research Project Cooperative Agreement Materials That Compute Advances as Engineers Demonstrate System Performs Pattern Recognition New HIF-2 Kidney Cancer Therapy More Effective than Current Treatment, Study Shows Biochemists' Discovery Could Lead to Vaccine Against 'Flesh-Eating' Bacteria 3-D Graphene Has Promise for Bio Applications Making Memories Stronger and More Precise During Aging Gene Therapy via Ultrasound Could Offer New Tool in Fight Against Heart Disease and Cancer New Understanding of Pulmonary Hypertension Leads to Promising Drug Targets Telemedicine Could Improve Eye Exam Access for People with Diabetes Probing How CRISPR-Cas9 Works Shifts in the Microbiome Impact Tissue Repair, Regeneration Sertraline, Brand Named Zoloft, Improves Functioning in Young Children with Fragile X Doctors Prescribe Diabetes Treatment Medications 15 Times More than Obesity Drugs Looking To Saliva to Gain Insight on Evolution Scientists Uncover Common Cell Signaling Pathway Awry in Some Types of Autism Flesh-Eating Infections in Rheumatoid Arthritis Patients Spur New Discovery Increased Eye Cancer Risk Linked to Pigmentation Genes That Dictate Eye Color MRI Technology Quantifies Liver Response in Nonalcoholic Steatohepatitis Patients Refining Optogenetic Methods to Map Synaptic Connections in the Brain Researchers Find Herpes Strain in the Nervous System Electrical Synapses in the Brain Offer New Avenue for Epilepsy Research and Possible Treatment Correcting Metabolic Deficiencies May Improve Depression Symptoms New Study Reveals a Novel Protein Linked to Type 2 Diabetes How Mechanical Force Triggers Blood Clotting at the Molecular Scale CRISPR Gene Editing Reveals New Therapeutic Approach for Blood Disorders Expanded Role of PARP Proteins Opens the Door to Explore Therapeutic Targets in Cancer Pulmonary Complications in Adult Survivors of Childhood Cancer Directly Reprogramming a Cell's Identity with Gene Editing 'Bursts' of Chromosome Changes Fuel Breast Cancer Tumor Growth University of Pittsburgh Licenses Novel Microneedle Patch to Pittsburgh Company From Sci Fi to Reality: Unlocking the Secret to Growing New Limbs Scientists Identify Marker for Myeloid-Derived Suppressor Cells Discovery of Infants' Airway Microbiomes May Help Predict Lung Disease Vision: When It Comes To Recognizing Shapes, Timing Is Everything How Epigenetics Regulate Vital Functions from Bacteria to Humans New Tool Enables Researchers to Rapidly Manipulate Protein Levels in Mammalian Cells Pitt Researchers Solve Mystery on How Regenerative Medicine Works Starving Immune Cell Discovery Points to Cancer Immunotherapy-Boosting Strategies Sampling Method Used for New Breast Cancer Tests May Lead to Underestimate of Risk NIH-Funded Pitt Research Study to Evaluate New Voice Therapy Technique More Doesnt Mean Better When it Comes to Trauma Centers Biotech Firm Licensing Pitt Patents Raises $57M Cumulative Risk for Relatively Safe Medication Like Statins Is Nontrivial Mice Survive Brain Cancer Tumors Lacking Key Surface Proteins Novel Compounds Arrested Epilepsy Development in Mice Ecologists Create a Framework for Predicting New Infectious Diseases Research Offers New Hope for Understanding Deadly Infections Researchers ID Cancer Gene-Drug Combinations Ripe for Precision Medicine Neural Networks: Why Larger Brains Are More Susceptible to Mental Illnesses Plant Compounds Give '1-2' Punch to Colon Cancer Researchers Temporarily Turn Off Brain Area to Better Understand Function Regenerative Medicine Improves Strength and Function in Severe Muscle Injuries Drs. Weinbaum, Kameneva, and Waters Receive CMI Grants New Fully Dissolving Heart Stent Biochemists Feed 'Poison Pill' to Deadly Virus Key to Regulating Cell's Powerhouse Discovered Local Drug Activation at Solid Tumor Sites Alzheimer's Gene May Show Effects on Brain Starting in Childhood Heart Failure After First Heart Attack May Increase Cancer Risk Extra-Coding RNAs Regulate DNA Methylation in the Adult Brain Mitochondria Are Exploited in Cancer for Tumor Cell Motility, Metastatic Competence HIV Study Confirms Clinically Viable Vaccine Paving the Way for Future Treatments Two Groundbreaking Studies Reflect New Paradigm in Breast Cancer Research Drs. Robert Parker and Gilles Clermont Receive NIH R21 Award Fabrication of Vascular Grafts with Artificial Stem Cells Gene Mutation 'Hotspots' Linked to Better Breast Cancer Outcomes New Technology Helps ID Aggressive Early Breast Cancer Tracking Brain Atrophy in MS Could Become Routine, Thanks to New Software Treating Autoimmune Disease Without Harming Normal Immunity A Little Spark for Sharper Sight Zika Virus Identified in Brain, Placenta Tissue, Strengthening Link to Birth Defects Broccoli Sprout Extract May Protect Against Oral Cancer Recurrence Incidence of Cancer in Patients with Large Colorectal Polyps Lower Than Previously Thought Dr. Rocky Tuan Receives Research Award to Conduct Studies on International Space Station Pitt Researchers Find Key to Parkinsons Disease Neurodegeneration Stanford and Pitt Collaborate on Successful Stroke Therapy Device for Irregular Heartbeat May Be More Cost-Effective Than Medication Extent of Resection Associated with Likelihood of Survival in Glioblastoma A Single Species of Gut Bacteria Can Reverse Autism-Related Social Behavior in Mice Future Treatment Strategies for Stomach Ulcers, Inflammatory Bowel Disease, and Alcoholic Liver Disease Shorter Radiation Course Recommended for Early-Stage Breast Cancer Patients Bioactive Film Improves How Implants Bond with Bone in Animal Study Impact of Antibiotic Treatment on Infant Gut Microbiome Revealed Engineering the Immune System to Kill Cancer Cells Super-Resolution Microscopy Reveals Unprecedented Detail of Immune Cells' Surface Researchers Find Potential Key to Preventing Heart Attacks, Strokes in Older Adults Pre- and Post-Testing Show Reversal of Memory Loss from Alzheimer's Disease in 10 Patients Simulations Describe HIV's 'Diabolical Delivery Device' DNA in 'Unbiased' Model Curls Both Ways Lifestyle Optimization to Prevent Disease Facial Reconstruction with Fat Grafting Chemical 'Sponges' Designed to Soak Up Toxic Cancer-Fighting Drugs After Targeting Tumors Swapping Sick for Healthy Brain Cells Slows Huntington's Disease Study Questions Cancer Link with Bone Growth Factor for Spinal Surgery Benefits to Timing Chemotherapy to Body's 'Awake' Time Stress-Diabetes Link Detailed in New Study Scientists Develop Protein with Potential to Modify Brain Function, Memory in Mice and Fish UPMC Researchers Shine Light on Common Heart Complication After Lung Transplantation 3D Bioprinted Model for the Study of Precancerous Breast Disease Aims to Reduce Unnecessary Treatment Dr. Chien Ho Develops Bio-Mimicry Method for Preparing and Labeling Stem Cells Study Finds That Protein Puts the Brakes on Melanin Restoring Chemotherapy Sensitivity by Boosting microRNA Levels Vitamin Nicotinamide Riboside Protects Mice from Diabetes Complications Zika Virus Infects Human Placental Macrophages First-of-Its-Kind Procedure Combines Scalp, Skull, Kidney, and Pancreas Transplant Fasting-Like Diet Reduces Multiple Sclerosis Symptoms Early-Life Stress Causes Digestive Problems and Anxiety in Rats New Study Uncovers Mechanisms Underlying How Diabetes Damages the Heart New Malaria Drugs Kill Plasmodium Parasites by Promoting Premature Parasite Division How Prions Kill Neurons: New Culture System Shows Early Toxicity to Dendritic Spines NSF Grant: Develop a Transistor Based on 2D Crystals to Lower the Energy Consumption of Electronics NIH Grant to Support Continuation of Joint Regenerative Medicine Program Between University of Pittsburgh and Carnegie Mellon University Received Sitting Too Long? Best Stretches for Your Back Flawed Data Behind Regulation of High-Risk Women's Health Devices Immune Cells Help Reverse Chemotherapy Resistance in Ovarian Cancer Lowering Blood Pressure Reduces Risk of Heart Disease in Older Adults Triple-Therapy Cocktail Shrinks Triple-Negative Breast Tumors Can a Healthy Lifestyle Prevent Cancer? Visual Impairment, Blindness Cases in US Expected to Double by 2050 3-D Bioprinted Placenta Could Lead to New Treatments for Preeclampsia Team Discovers New HIV Vaccine Target Gene Regulatory Mutation Linked to Rare Childhood Cancer Diabetes Drug Found No Better Than Placebo at Treating Nonalcoholic Fatty Liver Disease Size of Brain Region Is Associated with Response to PTSD Treatment Voice of America Features Trilogy of McGowan Institute Research Programs Bioengineered Blood Vessel Is Safe for Dialysis Patients, Study Finds Genetic Biomarker May Predict Nerve Pain Side Effects Associated with Prostate Cancer Treatment Repetitive, Subconcussive Head Impacts from Football Associated with Short-Term Changes in Eye Function Omega-3 Lowers Childhood Aggression in Short Term Scientists Find What Might Be Responsible for Slow Heart Function under General Anesthesia Pitt-Developed Drug Works Against Superbug Biofilms and Respiratory Virus New Treatment for Children with Acute Respiratory Distress Syndrome No Longer Lost in Translation: Biochemists Watch Gene Expression in Real Time T Cells Use 'Handshakes' to Sort Friends from Foes Gene Linked to Alzheimer's Disease Impairs Memory by Disrupting Brain's 'Playback System' Drs. Rory Cooper and Dan Ding Receive Pitt Chancellors Innovation Commercialization Funds Drug-Like Peptides Show Promise in Treating Two Blood Diseases Mothers' Excess Pregnancy Weight Gain, Elevated Blood Sugar 'Imprint' Obesity in Children Blood Analyses May Predict Risk of Delirium in Older Surgical Patients Zika Virus May Cause Microcephaly by Hijacking Human Immune Molecule Quick Test for Zika Effectively Detects Virus in Monkeys Scientists Put Some Muscle Behind Their Research Rapid-Response Immune Cells Are Fully Prepared Before Invasion Strikes Climate Change May Contribute to Rising Rates of Chronic Kidney Disease Genetic Variants in Patients with Crohn's Disease Prevent 'Good' Gut Bacteria from Working Portable Device Worn on Eyeglasses Offers Hope for People with Low Vision Animal Study Shows Flexible, Dissolvable Silicon Device Promising for Brain Monitoring Researchers Track Critical Development in the Young Brain Research Grant Received: Use of Cells from Patients Own Fat as Vascular Grafts in Arterial Bypass Surgery Dr. Joon Sup Lee: Advancements in Cholesterol Control Help Move Cardiology Forward Study Pinpoints Mechanism That Allows Cells with Faulty DNA to Reproduce Cell Transplant Treats Parkinson's in Mice Under Control of Designer Drug Study Identifies a Key to Bone Formation, Vertebrate Evolution Four New Genetic Diseases Defined Within Schizophrenia Age-Dependent Changes in Pancreatic Function Related to Diabetes Identified Study Links Residential Radon Exposure to Hematologic Cancers in Women TJP1 Protein May Identify Multiple Myeloma Patients Most Likely to Benefit from Proteasome Inhibitors Scientists Predict Cell Changes That Affect Breast Cancer Growth RNA Splicing Mutations Play Major Role in Genetic Variation and Disease How Cancer Cells Escape From Tumors, Spread Risk Factors Associated with Injurious Falls in the Elderly COPD Linked to Increased Bacterial Invasion Shape of Tumor May Affect Whether Cells Can Metastasize Even a Little Air Pollution May Have Long-Term Health Effects on Developing Fetus How Breast Cancer Cells Slide to Metastasis Study on Fragile X Syndrome Uses Fruitfly's Point of View to Identify New Treatments Minimally Invasive Colitis Screening Using Infrared Technology Could Offer Fast, Simple Test Scientists Reveal Secrets of a Deadly Virus Family Quick Mapping of Our Microbiomes and Metabolomes Cholesterol Levels, Not Statins, Influence Colorectal Cancer Risk Vessel Damage May Precede Diabetic Retinopathy, Researchers Find Scientists Teaching Machines to Make Clinical Trials More Successful Technique Measures 'Postural Sway' to Diagnose Neuromuscular Disorders Pre-Surgical Exposure to Blue Light Reduces Organ Damage in Mice McGowan Institute Technology for Organ and Tissue Preservation Is TechConnect 2016 Award Winner In Child Heart Patients, Novel Approach Improves Symptoms of Hazardous Lymph Blockage Scientists Harness Nature's Transport System to Brain Researchers Develop Magnifying Smartphone Screen App for Visually Impaired Zinc Deficiency May Contribute to Increased Inflammation Among HIV-Positive Individuals Genes That Control Smooth Muscle Contraction Identified Cell Death Mechanism May, Paradoxically, Enable Aggressive Pancreatic Cells to Live On Sophisticated 'Mini-Brains' Add to Evidence of Zika's Toll on Fetal Cortex How Skeletal Stem Cells Form the Blueprint of the Face Dr. Steffi Oesterreich Joins Susan G. Komen As Advisor, New Komen Scholar Dr. Paul Monga to Lead New Multidisciplinary Liver Center Paper Wins International Dupuytren Award 2016 Researchers Identify Potent Antibodies Against HIV Genetic Elements that Drive Regeneration Uncovered Researchers Visualize Brain's Serotonin Pump, Provide Blueprint for New, More Effective SSRIs Much Longer Survival for Heart Transplants Across Species Brain Guardians Remove Dying Neurons Novel 3-D Imaging Offers New Tool for Identifying Advanced Fibrosis in Liver Certain Gastrointestinal Tumors Associated with Higher Mortality Controlling Cell Turnover in the Intestinal Lining Exome Sequencing Improves Doctors' Ability to Diagnose Hard-To-Pin-Down Neurogenetic Disorders Most Patients Likely to See Reductions in Pain and Disability after Bariatric Surgery; Study Identifies Who Benefits Most Seeing Cell To Cell Differences for First Time Explains Symptoms of Rare Genetic Disorders Applying Parameter Selection, Verification Techniques to an HIV Model Researchers Tackle Mystery of Protein Folding Prostate-Specific Antigen Screening Publications Influence Biopsy Rates, Associated Complications Proteins Associated with Schizophrenia Hang Around Longer than Previously Thought Improved Patient Outcomes Linked to Specific Health IT Resources in Hospitals Scientists Issue Report on Advances in Basal Cell Carcinoma Therapy 'Cancer Gene' Twice as Likely to Be Defective in Children with Autism Brain Cancer: Two Essential Amino Acids Might Hold Key to Better Outcomes New Cardiovascular Device That Reduces Risk of Stroke Study of Enzymatic Chemical Reactions by Pitt and Penn State Researchers May Indicate How the First Cells Formed Colonies ECM May Treat Stroke Patients Wnt Secretion Preventing Drugs May Reduce Renal Fibrosis, Study Shows Looking at the Bacteria Inside: New Method of Viewing TB Bacteria Sequence Features Accurately Predict Genome-Wide Mecp2 Binding In Vivo Genetic Changes That Cause Autism Are More Diverse Than Previously Thought Presence of Hormone at Key Developmental Period May Point to Origin of Type 2 Diabetes in Kids Microneedle Patch Delivers Localized Cancer Immunotherapy to Melanoma Curcumin May Help Overcome Drug-Resistant Tuberculosis Unraveling the Mystery of Stem Cells Live-Imaging Technique for Mice Seen as Boost to Studies of Brain Function, Development Neuron Type-Specific Gene Loss Linked to Angelman Syndrome Seizures Dr. Peter Rubin Receives Pittsburgh Health Data Alliance Project Funding Nutrition and Surgical Site Infections: Study New Gene Identified as Cause, Early Indicator of Breast Cancer Study Sheds Light on Patterns Behind Brain, Heart Systems; Circadian Rhythms Why Are Women More Prone to Knee Injuries Than Men? New Technique for Imaging Cells, Tissues Under the Skin Single Brain Cells Reveal Genes Controlling Formation, Development Bariatric Surgery Better Than Intensive Lifestyle, Drug Interventions at Reversing Diabetes in Mildly to Moderately Obese Patients Subset of E. coli Bacteria Linked to Deadly Disease in Pre-Term Infants Women with Impaired Stress Hormone Before Pregnancy Have Lower-Birthweight Babies Future Brain Therapies for Parkinson's Possible with Stem Cell Bioengineering Innovation Imbalance Between Gut Microorganisms, Immune Cells Could Set Stage for Autoimmune Disease Study Shows Spinal Cord Stimulation Reduces Emotional Aspect of Chronic Pain Chemists Develop an Ultra-Sensitive Test for Cancers, HIV Dr. Fabrisia Ambrosio Nets Two NIH Awards FDA: In Silico Trials for Advancing New Devices and Drug Therapy Applications Change in Mosquito Mating May Control Zika Virus Newly Identified Immunity Pathway Protects Mammals from Virus-Caused Cancer Can Nutritional Supplements Impact Genetic Hearing Loss in Children? The Dangers, Risks of Binge Drinking Burning More Calories Associated with Greater Gray Matter Volume in Brain, Reduced Alzheimers Risk Researchers Develop Promising Candidate for Next-Generation Anti-Malarial Drug Virus Depends on a Micro-RNA to Replicate Normal Stem Cells Linked to Aggressive Prostate Cancer Research on Treatments for Advanced Ovarian Cancer Predictive Proteins: Elevated Levels Trigger Metastatic Progression of Cancer Cells Molecular 'Brake' Prevents Excessive Inflammation Cooling Technique Protects Speech During Brain Surgery Bariatric Surgery May Reduce Life-Threatening Heart Failure Exacerbation in Obese Patients Discovery of Key Abnormality Affecting Brain Development in People with Down Syndrome Enzymatic Engines Gene Therapy for Parkinsons Disease to Be Tested by Pitt, UPMC Experts Redefining Sepsis: An International Effort to Improve Patient Outcomes Local Start-Up Based on McGowan Institute Technology Prepares for 2017 US Clinical Trials A Retinal Prosthesis for the Blind Moving Around More Linked to Longer Life Chagas Disease: A Wake-Up Call to Accelerate the Diagnosis, Treatment, and Research Source of Cells Used to Generate New Tissue May Be Important to Personalized Medicine Experimental Ebola Antibody Protects Monkeys Potential Diagnostic for Dengue Fever Outcomes Based on Metabolomic Profiles Only a Small Portion of Synapses May Be Active During Neurotransmission, Study Finds Scientists Prove Feasibility of 'Printing' Replacement Tissue Corneacopia New Study Shows Promise of ALungs Hemolung Technology to Help Protect the Injured Lung Preventive Surgery for Women at High Risk of Breast, Ovarian Cancer Drug Prevents Key Age-Related Brain Change in Rats 'Gene Fusion' Mutation Uses Three-Way Mechanism to Drive Childhood Brain Cancers The Future of Medicine Could Be Found in This Tiny Crystal Ball Energy from Cellphone Towers Amplify Pain in Amputees It's All About the Timing: Fetal Expression of Core Clock Gene Determines Lifespan in Mice Novel Nanoparticle Made of Common Mineral May Help Keep Tumor Growth at Bay Enzyme Key to Link Between Age-Related Inflammation and Cancer Study Identifies Mechanism for Drug Target to Help Block HIV's Ability to Spread New Light Shed on Anti-Adhesive Molecule in the Vascular Endothelium Sharpin Emerges From the Pack as a Regulator of Inflammation New Drug Target for Rett Syndrome Collagen, Heparan Sulfate Coatings Alter Cell Proliferation, Attachment What Goes Wrong in the Brain When Someone Can't Spell Fabricating Devices for the Detection and Separation of Target Molecules from Complex Fluids DBS: Treating Movement Disorders Delivering Genes Across the Blood-Brain Barrier First Topical Treatment for Common Benign Skin Lesions Discovered: How to Unlock Inaccessible Genes Scientists Discover Protein's Starring Role in Genome Stability, and Possibly Cancer Prevention New Therapy Halts Progression of Lou Gehrig's Disease in Mice Protein Combination Improves Bone Regeneration, Study Shows Scientists Decode Brain Signals Nearly at Speed of Perception Chemists Uncover How Key Agent Allows Diseases to Reproduce Treating Parkinson's Disease by Solving the Mysteries of Movement Food Additive that May Prevent Skin Cancer Revealed by Scientists Promising Results from Clinical Study Using Plasmid DNA Gene Therapy Clinical Milestone Reached with 500 Minimally Invasive Heart Valve Repairs Gene Therapy for Rare Bleeding Disorder Achieves Proof-of-Concept Closer Look at Heart Cell Connectors Could Catch 'Hidden' Rhythm Disorders in the Future Immunity Genes Could Protect Some from E. Coli While Others Fall Ill Using Electrical Signals to Train the Heart's Muscle Cells Slow Heart Rate Does Not Increase Risk of Heart Disease Infant-Friendly Flu Vaccine Developed with Key Protein Genetics Influences Knee Pain Sensitivity in Osteoarthritis Patients Tiny Electronic Implants Monitor Brain Injury, Then Melt Away Link Between Obesity, Increased Risk of Colorectal Cancer Revealed Breast Cancer Study Suggests New Potential Drug Targets and Combinations Versatile New Way to Build Molecules Developed Flexible Film May Lead to Phone-Sized Cancer Detector Key Pathway Involved in Blood Vessel Occlusion Discovered Signals That Make Early Stem Cells Identified Low Blood Levels of Bicarbonate Linked to Earlier Death in Healthy Older Adults What You Eat Can Influence How You Sleep Trio of Autism-Linked Molecules Orchestrate Neuron Connections How the Cell's Power Station Survives Attacks Researchers Kill Drug-Resistant Lung Cancer with 50 Times Less Chemo How Bacterial Communication 'Goes With the Flow' in Causing Infection, Blockage Sedentary Behavior Linked to Poor Health in Adults with Severe Obesity, Independent of Exercise Unraveling the Genetics of Pregnancy and Heart Failure Kidney Injury Common Following Vascular Surgery Simple Shell of Plant Virus Sparks Immune Response Against Cancer Toxic Secretions from Intracranial Tumor Damage the Inner Ear Not Enough YAP Means Too Much Deadly Inflammation Inside the Brain Research Links Inorganic Mercury Exposure to Damaged Cell Processes Nature's Masonry: First Steps in How Thin Protein Sheets Form Polyhedral Shells Absence of Serotonin Alters Development, Function of Brain Circuits Study Uncovers Inherited Genetic Susceptibility Across 12 Cancer Types Vitamin D Levels Linked to Weight-Loss Surgery Outcomes Medical First: Discovery of Warning Symptoms for Usually Fatal Heart Rhythm Malfunction Vitamin A Quells Severity of Preemie Gastrointestinal Disease in Mice Simple Physical Mechanism for Assembly and Disassembly of Structures Inside Cells Stroke Recovery in Mice Improved by Ambien, Study Shows Researchers Identify Potential Approach to Treat Heart Disease Through the Gut Experimental Drugs That Change Energy Supply in Cells Could Slow Brain Tumor Growth Liver Protein Boosts Growth of Insulin-Producing Cells Bones of Obese Children May Be in Trouble Dry Eye Linked to Chronic Pain Syndromes Suicide Gene Therapy Kills Prostate Tumor Cells Neural Stimulation Offers Treatment for 'Dry Eye' ASU-Led Researchers Add New Worldwide Resource to Explore Genes' Deep and Hidden Messages Researchers Report Possibility of Using Unused Human Pancreata to Build New Organs Scientists Show How Drug Molecules Regulate a Medically Important Protein Brain Function: First Look at How Astrocytes Function in Humans Recently Approved Heart Drug Poses Potential Risk to Brain and Eye, Researcher Warns Functional Biomarker for Age-Related Macular Degeneration UF Health Researchers Use Gene Therapy to Extend Estrogen's Protective Effects on Memory Combining Adult Stem Cells with Hormone May Speed Bone Fracture Healing A New Way to Deliver MicroRNAs for Cancer Treatment New Method to Calculate Lifetime Energy Requirements of Cells, Genes Nanocarriers May Carry New Hope for Brain Cancer Therapy Scientists Identify Mechanism That May Help Prostate Cancer Cells Escape Effects of Cancer Drugs Ranibizumab Found Effective Against Diabetic Retinopathy Impact of High-Fat Diet on Red Blood Cells May Cause Cardiovascular Disease Molecular Mechanism at Root of Familial Amyloidosis and Other Diseases Grabbing a Parasite by the Tail: Team Solves 'Jumping Gene' Mystery Batten Disease May Benefit From Gene Therapy New Stem Cell Gene Correction Process Puts Time on Researchers' Side Researchers Develop 'Killer Cells' to Destroy Cancer in Lymph Nodes New Study Provides Possible Way to Overcome Stem Cell Researchs Developmental Arrest Problem Novel Stem Cell Line Avoids Risk of Introducing Transplanted Tumors Researchers Find Greater Genetic Diversity Among Cancer Cells Than Anticipated Tissue Engineers Recruit Cells to Make Their Own Strong Matrix New Study: Leading Cause of Blindness Could Be Prevented or Delayed Rice U. Paper: End 'Stem Cell Tourism' Irx Genes Make Cartilage Cells Act 'Oh So Immature' Compound Protects Against Cell Damage That Leads to Macular Degeneration JEDI T-Cells Provide Unique Technology to Study, Visualize Immune Responses and Immunotherapies Study Sheds Light on Side Effects of COX-2 Drugs Hybrid Material that Responds to Heat and Light Presents Future Potential for 4D-Printed Adaptive Devices Guided Ultrasound Plus Nanoparticle Chemotherapy Cures Tumors in Mice Genetic Link Between Heart and Neurodevelopmental Disease New Tools Yield Superior Genome Analysis Results Safe Form of Estrogen Helped Multiple Sclerosis Patients Avoid Relapses TGen and Barrow Identify Genes Linked to Stress-Triggered Heart Disease Researchers Grow Retinal Nerve Cells in the Lab A Better Way to Grow Bone Cells How Cells in the Developing Ear 'Practice' Hearing Researchers Discover How Immune Cells Resist Radiation Treatment Umbilical Cells Help Eyes Neurons Connect Immunotherapy for Type 1 Diabetes Deemed Safe in First US Trial High-Fat Diet Prompts Immune Cells to Start Eating Connections Between Neurons A Possible End to Eye Drops 5 Years and Growing: Regenerative Rehabilition Working in Collaboration to Prevent Blindness Retinal Regeneration Is a Fishy Problem New Test May Improve Diagnosis, Treatment of Pancreactic Cancers Stem Cell Treatment Mediates Immune Response to Spinal Cord Injury in Pre-Clinical Trials Biologists Characterize New Form of mRNA Regulation Can Stem Cell Technology Be Harnessed to Generate Biological Pacemakers? Eye Drops Could Clear Up Cataracts Using Newly Identified Chemical Cancer Cells Hijack Glucose, Alter Immune Cells Eye Drops Deliver Gene Therapy for Brain Disorders NIH Mouse Study Embryonic Stem Cells and Artificial Stem Cells Are Functionally Equivalent Nanotechnology Could Spur New Heart Treatment for Arrthymia Bipolar Patients Brain Cells Predict Response to Lithium Targeting Invasive Cells Could Be a New Strategy to Treat Metastatic Cancer, Say Stony Brook Researchers Precursor Cells Discovered That Could Help Regrow Heart Arteries New Eye Structures Discovered Grant Award: Engineered Neovascularization of Vasa Vasorum Tumor RNA in Platelets May Diagnose and Classify Cancer, Identify Treatment Strategies New Computational Strategy Finds Brain Tumor-Shrinking Molecules A Prkci Gene Keeps Stem Cells in Check Discovery of Genes Involved in Inner Ear Development Hints at a Way to Restore Hearing and Balance Cardiac Muscle Cells as Good as Progenitors for Heart Repair Biologists Unravel Drug-Resistance Mechanism in Tumor Cells Gene Therapy Treats All Muscles in the Body in Muscular Dystrophy Dogs Stem Cell Biology and Gene-Editing Techniques Offer Hope for Kidney Regeneration Study Finds Thyroid Function May Be Restored Through Patient-Derived Human Cells A Subpopulation of White Blood Cells Guards Against Tumor Lung Metastasis Penn Dental Medicine Study Shows How Stem Cell Therapy Protects Bone in Lupus Gene Therapy Could Aid Weight Loss Without Affecting Bone Loss, New Research Finds Langmuir Features Work of Dr. Anna Balazs Chronic Arsenic Exposure Can Impair Ability of Muscle to Heal After Injury Something on Your Mind? Study Identifies Patients Most Likely to Have Joint Pain Reduction After Bariatric Surgery New Study Reveals How Specialized Cells Help Each Other Survive During Times of Stress Mechanism Identified for Enhancing Immunological Memory in Helper T Cells Scientists Find Way to Make Leukemia Cells Kill Each Other Scientists Make Advancements that May Lead to New Treatments for Parkinson's Looking at Retinal Cells May Provide New Approach to Assessing Anesthetic Neurotoxicity in Children Investigators Create Complex Kidney Structures from Human Stem Cells Derived from Adults Promising USC Study Focuses on Treatment for Dry Eyes Prostate Cells Undergo 'Reprogramming' to Form Tumors, Study Finds Researchers Gauge Heritability of Childhood-Onset Autoimmune Diseases Study Stops Vision Loss in Late-Stage Canine X-Linked Retinitis Pigmentosa Artificial Lung Demonstrates How Aerosols Move and Behave in Deepest Part of Lungs Huntington's Disease Protein Controls Movement of Precious Cargo Inside Cells, Study Finds Screen of Human Genome Reveals Set of Genes Essential for Cellular Viability Scientists Produce Clearest-Ever Images of Enzyme That Plays Key Roles in Aging, Cancer Stem Cell Treatment May Reduce Impairment Caused by Dementia Engineers Create Artificial Skin That Can Send Pressure Sensation to Brain Cell Special Class of T Cells Shown to Both Attack Cancer Cells and Enlist Other Immune Cells Sleep Deprivation Affects Stem Cells, Reducing Transplant Efficiency, Study Finds Blood T Cells Are Resistant to HIV's Primary Death Pathway Study Shows Deadly Prostate Cancer Cells Have Stem Cell Qualities Research: Epigenetic Factor Reduces Sensitivity of Breast Cancer Cells to Common Cancer Drug Scientists Engineer Stem Cells to Better Understand Mechanisms Behind Leukemia Throwback 1985: First Artificial Heart Used in Pittsburgh Bioprinting Soft Human Tissues Clinical Project Being Conducted at Walter Reed Pitt Spinout Company Wins 2015 Innovator of the YearLife Sciences Tech 50 Award Pitt Hosts Representatives of the DoD Regenerative Medicine Traveling Exchange Program Pittsburghs 25th Anniversary of First VAD Patient to Be Discharged from a Hospital High Dose Chemo and Stem Cell Transplantation Result in Long-Term Survival for Amyloid Patients Researchers Learn How to Grow Old Brain Cells Johns Hopkins Biologist Leads Research Shedding Light on Stem Cells Virus-Drug Combination Shows Improved Effectiveness Against Brain Tumor Cells Approach or Buzz Off: Brain Cells in Fruit Fly Hold Secret to Individual Odor Preferences Scientists Test New Gene Therapy for Vision Loss from a Mitochondrial Disease Artificial Heart Design Features Porous Plastic Foam Dormant Viral Genes May Awaken to Cause ALS Scientists Identify Genes That Shut Down HIV-1 New Gene Therapy Approach to Treating DMD Reduces Symptoms, Extends Life Span in Mouse Model A Natural Light Switch Remote Control of Immune Cells Opens Door to Safer, More Precise Cancer Therapies Sticky Gel Helps Stem Cells Heal Rat Hearts New Cancer Genes Identified, Opening Door to Targeted Treatments Metastatic Breast Cancer Cells Turn on Stem Cell Genes Arteries May Be Best Source for Detecting Circulating Tumor Cells Researchers Find Potential Source of Insulin-Producing Cells in Adult Human Pancreas Researchers Isolate Human Muscle Stem Cells Stem Cell-Derived Organoids Help Predict Neural Toxicity Researchers Identify New Pathway to Regenerate Insulin-Producing Cells New Technique Lets Scientists See and Study the Interface Where Two Cells Touch Lab-Grown 3-D Intestine Regenerates Gut Lining in Pre-Clinical Trial Strengthening a Tiny Heart, Pound for Pound Pitt Researchers Are Working to Mass-Produce Stem Cells Grant: Regenerative Medicine Therapy for Abdominal Aortic Aneurysm Cancer Doesn't Sleep: MYC Oncogene Disrupts Clock, Metabolism in Cancer Cells E. Coli More Virulent When Accompanied by Beneficial Bacteria Network Control: Letting Noise Lead the Way Vaccine Clears Some Precancerous Cervical Lesions in Clinical Trial Diet, Exercise, Smoking Habits, and Genes Interact to Affect AMD Risk Exosomes Provide a Promising Way to Induce Human Stem Cell Differentiation In First, Scientists Use Sound Waves to Control Brain Cells Study Demonstrates Genes' Major Role in Skin and Organ Development Filling a Void in Stem Cell Therapy Switched Before Birth: Study Shows Protein Creates Tumor-Fighting Rather Than Tumor-Protecting Cells Bar-Coding Technique Opens Up Studies Within Single Cells Researchers Report Long-Term Remissions in First Personalized Cell Therapy Trial Silk Bio-Ink Could Help Advance Tissue Engineering with 3-D Printers Time-Lapse Analysis Offers New Look at How Cells Repair DNA Damage DNA-Guided 3-D Printing of Human Tissue is Unveiled Circuit in the Eye Relies on Built-in Delay to See Small Moving Objects Inducing Metabolic Catastrophe in Cancer Cells 'Eat Me' Signal Whets Appetites for Tumor-Devouring Dendritic Cells The Alien Within: Fetal Cells Influence Maternal Health During Pregnancy (and Long After) Degenerating Neurons Respond to Gene Therapy Treatment for Alzheimer's Disease Research with UWF Imaging May Change How Diabetic Eye Disease Is Assessed and Treated Synthetic Tissue Environment Enables Spatial Definition of Cancer Cells and Macrophages Imaging Techniques Set a New Standard for Super-Resolution in Live Cells Grant to Research Olfaction, Anosmia Awarded Novel Genes Found in Inflammatory Bowel Disease Under Age 5 Variations in Cell Programs Control Cancer and Normal Stem Cells Gene Therapy Fully Restores Vision in Mouse Model of Leber Congenital Amaurosis Newly Discovered Cells Regenerate Liver Tissue Without Forming Tumors Can Stem Cells Cause and Cure Cancer? New Clues Found to Vision Loss in Macular Degeneration? New Research Tool Tracks Real-Time DNA-Protein Binding in Cells Key Protein Drives 'Power Plants' That Fuel Cells in Heart and Other Key Body Systems Juvenile Arthritis: Why Genetic Risk Is Not in the Genes Digestible Batteries Needed to Power Electronic Pills Grant Received for the Alliance for Regenerative Rehabilitation Research & Training International Consortium for Regenerative Rehabilitation Leadership Council Established Studies into Mitigating Effects of Radiation to Continue Researchers Thwart Cancer Cells by Triggering 'Virus Alert' HIV Particles Do Not Cause AIDS, Our Own Immune Cells Do Vitamin D May Play Key Role in Preventing Macular Degeneration Algorithm Helps Identify Elusive Genes That Express Like Clockwork Researchers Find New Code That Makes Reprogramming of Cancer Cells Possible Screening for Breast/Ovarian Cancer Risk Genes Other Than BRCA1/2 is Clinically Valuable Asthma Cells Scramble Like 'There's a Fire Drill' Receptor That Helps Protect Brain Cells Has Important Role in Support Cells for the Retina New Computational Method Predicts Genes Likely to be Causal in Disease Study Provides Hope for Some Human Stem Cell Therapies NYBC, UC Davis Health System Partner to Manufacture Potential Stem Cell Therapies Contrary to Previous Studies, Diabetes Affects Diaphragm, Skeletal Muscle Cells Differently Joining Molecular Components Expands Ability to Manipulate Genes in Specific Cell Types In Uveitis, Bacteria in Gut May Instruct Immune Cells to Attack the Eye 'Jumping Genes' Unusually Active in Many Gastrointestinal Cancers, Studies Find Stanford Researchers Genetically Engineer Yeast to Produce Opioids Blood Vessel 'Doorway' Lets Breast Cancer Cells Spread Through Blood Stream Pancreas Cancer Spread From Multiple Types of Wayward Cells Drug Candidate Kills Cancer Cells through Overstimulation Gene Therapy Hope for Recurrent Ovarian Cancer Patients Dr. Anna Balazs Manuscript Chosen as an ACS Editors' Choice from All ACS Journals Childrens Hospital of Pittsburgh Foundation Invests in Cardiovascular Regeneration Research Protein-Hydrogel Combo May Help Heal Heart In Lab Tests, New Therapy Slows Spread of Deadly Brain Tumor Cells MSU Scientists Set Sights on Glaucoma Medication to Treat TB Patients' Own Genetically Altered Immune Cells Show Promise in Fighting Blood Cancer Stem Cells Have More Reserves for DNA Replication Tiny Brain Clumps Offer New Clues into the Cause of Autism Vision-Restoring Gene Therapy Also Strengthens Visual Processing Pathways in Brain, According to Penn Study OHSU Scientists Unlock First Step Towards Gene Therapy Treatment of Mitochondrial Disease Research Finds Ovarian Hormones Play Genes Like a Fiddle Adults Harbor Lots of Risky Autoreactive Immune Cells, Study Finds New Techniques for Reprogramming Stem Cells Target Neurological Disease Models Printing 3-D Graphene Structures for Tissue Engineering What Makes Cancer Cells Spread? New Device Offers Clues Lung Cell Phenotype Reverts When Seeded Onto Decellularized Lung Matrix Registration Now Open: 2015 Symposium--Regenerative Surgery: The Cutting Edge Studying the Advances in Next-Generation Stem Cell Culture Technologies Pitt Researchers Will Study Sepsis with $1.5M NIH Grant Pitts Center for Medical Innovation Awards Round-1 2015 Pilot Funding New High Definition Fiber Tracking Preserving Photoreceptor Cells Following Retinal Injury Using Low-Dose Irradiation, Researchers Can Now Edit Human Genes Imaging Glucose Uptake Activity Inside Single Cells Dental Researchers Find Some Immune Cells Change to Prolong Inflammation Pilot Clinical Trial Finds Injected Immune Cells Safe in Multiple Myeloma Patients Microchip Captures Clusters of Circulating Tumor Cells Bigger Capsules May Be Long-Sought Key for Transplanting Islet Cells Programming Adult Stem Cells to Treat Muscular Dystrophy and More by Mimicking Nature Stem Cells Move One Step Closer to Cure for Genetic Diseases Researchers Poke Around for Blood Genes Nanoparticle Transport System for Genes Thwarts Brain Cancer in Rats Study Finds Vitamin A Directs Immune Cells to the Intestines Biomaterial Scaffold Implanted After Spinal Cord Injury Promotes Nerve Regeneration Disrupting Cells Powerhouses Can Lead to Tumor Growth, Penn Study Finds Age-Related Self-Destruction of Cells Makes Kidney Prone to Injury New Publications Show Promise of Improved Artificial Lung Devices Save the Date: 9th Symposium on Biologic Scaffolds for Regenerative Medicine Subset of Plasma Cells Represent 'Historical Record' of Childhood Infections Researchers Create Model of Early Human Heart Development from Stem Cells Stem Cells Provide Lasting Pain Relief in Mice Bonelike 3-D Silicon Synthesized for Potential Use with Medical Devices Researchers Identify Critical Genes Responsible for Brain Tumor Growth Sculpting a Cell's Backside: New Protein Found to Help Cells Move from Behind Enriched Blood Cells Preserve Cognition in Mice with Features of Alzheimer's Disease Researchers Explore How Sox9 Protein Regulates Production of Cartilage City of Hope Researchers to Use Patients' Own Modified T Cells to Treat Advanced Brain Tumors LSD1 Enzyme Turns Off Genes Needed to Maintain Cancer Stem Cell Properties in Glioblastoma Study Shows That Microglia Can Accelerate Damage Wrought by Blinding Eye Disorders Study of Gene Mutations in Aplastic Anemia May Help Optimize Treatment Discovery of Nanotubes Offers New Clues About Cell-to-Cell Communication Research Finds Protein Regulation Linked to Cells' Growth Cycle Seeking Rare Cells Study Shows Acute Pulmonary Fibrosis May Respond to Autoimmune Disease Therapy Beyond Average: New Platforms Genetically Barcode Tens of Thousands of Cells at a Time Elastic Gel to Heal Wounds Genes May Not Be to Blame for Link Between Migraine and Heart Disease New Measurements Reveal Differences Between Stem Cells for Treating Retinal Degeneration Scientists Develop Potential New Class of Cancer Drugs in Lab Research Team Finds Different Immune Response in Severe Asthma Team Programs Solitary Yeast Cells to Say Hello to One Another Stem Cell Gene Therapy Developed at UCLA Holds Promise for Eliminating HIV Infection Stanford Team Develops Technique to Magnetically Levitate Single Cells Researchers Uncover Epigenetic Switches that Turn Stem Cells into Blood Vessel Cells MARCKS Protein May Help Protect Brain Cells from Age Damage Skip a Beat? Your Auditory Nerve Cells Will Know It Dr. Anna Balazs: NSF Interview Exploring the Future of Eye Transplantation Type 2 Diabetes Remission for Bariatric Surgery Researchers ID Best Source of Stem Cells to Block Diabetic Blindness Targeting Telomeres, the Timekeepers of Cells, Could Improve Chemotherapy Cells Too Stiff to Scavenge Leads to Lupus, an Autoimmune Disease Human Cells Used to Create Disease Model of Fully Functioning Lipid System in Mouse Model Returning Killer T Cells Back to Barracks Could Improve Vaccines New Stem Cell Population Important in the Growth of Colon Cancer Identified Bascom Palmer Researchers Discover Protein that Leads to Glaucoma Pneumonia Found to Harm DNA in Lung Cells Tuberculosis Bacteria Hide in the Low Oxygen Niches of Bone Marrow Stem Cells Computer Simulation Predicts Development, Progress of Pressure Sores What Your Clothes May Say About You Safety Switch Preserves Beneficial Effects of Cell Therapy Drug Perks Up Old Muscles and Aging Brains Study Shows Role of Disease-Fighting Cells in HIV-Related Neurological Damage Gene Found That Is Essential to Maintaining Breast and Cancer Stem Cells Master Orchestrator of the Genome is Discovered, UB Stem Cell Scientists Report Mutations in Two Genes Linked to Familial Pulmonary Fibrosis and Telomere Shortening Odd Histone Helps Suppress Jumping Genes in Stem Cells, Study Says Gene Therapy Benefits for Some Vision Disorder Patients Peak, Then Decline Tuning Cells in the Key of G Proteins U.S. Clinics Avoiding Government Oversight of 'Stem Cell' Treatments Protein in Metabolic Reprogramming Restrains Senescent Cells from Becoming Cancerous Vital Step in Stem Cell Growth Revealed: Finding Could Aid Regenerative and Cancer Therapies Scientists Find Way to Monitor Progress of Stem Cells After Transplantation Into Brain Researchers Use 'Knockout Humans' to Connect Genes to Disease Risk Researchers Deliver Large Particles Into Cells at High Speed More Anti-inflammatory Genes Mean Longer Lifespans for Mammals Neural Stem Cell Implants Hold Promise for Treating Epilepsy Key Tissue Engineering Step Taken in Forming New Blood Vessels Scientists Observe Deadly Dance Between Nerves and Cancer Cells Nerve Cells, Blood Vessels in Eye 'Talk' to Prevent Disease Study Reveals How FOXO1 Slows Diabetic Wound Healing More Power to the Mitochondria: Cells' Energy Plant Also Plays Key Role in Stem Cell Development Understanding How Nerve Cells in the Brain Produce Energy Required to Function Stem Cell-Based Therapy Promising for Treatment of Breast Cancer Metastases in the Brain Investigators Show How Immune Cells Are 'Educated' Not to Attack Beneficial Bacteria Dead Feeder Cells Support Stem Cell Growth Nanotech-Enabled Moisturizer Speeds Healing of Diabetic Skin Wounds Tumor Cells that Mimic Blood Vessels Could Help Breast Cancer Spread to Other Sites Defect Found in Pancreatic Cells Could Lead to New Diabetes Treatment Contact Lens Sensor Safe for Patients with Thyroid Eye Disease Gene Therapy Clips Out Heart Failure Causing Gene Mutations New Therapy from Naive Cells Attacks High-Risk Viruses in Cord Blood Transplant Patients How an RNA Gene Silences a Whole Chromosome Prenatal Stem Cell Treatment Improves Mobility Issues Caused by Spina Bifida Ultrasound Settings Can Change Beat Frequency of Cardiac Cells Pancreatic Cancer Breakthrough: Scientists Turn Cancer Cells Into Normal Cells Drugs That Activate Brain Stem Cells May Reverse Multiple Sclerosis Angiogenesis Inhibitors Undermined by Immune Cells, Says Study Virtual Reality May Be Effective Tool for Evaluating Balance Control in Glaucoma Patients New Transitional Stem Cells Discovered Stem Cell Treatment Repairs Birth Defect, Provides Facial Regeneration for People Suffering Traumatic Injury Immune Cells Help 'Good Bacteria' Triumph Over 'Bad Bacteria' in the Gut How Breast Cancer Cells Avoid Cell Death Research Finds No Correlation Between Regulatory T Cells and Survival in Glioblastoma Scientists Uncover How Molecule Protects Brain Cells in Parkinson's Disease Model Stem Cell Scientists Develop More Effective Way to Create Motor Neurons Stem Cell Injection May Soon Reverse Vision Loss Due to Age-Related Macular Degeneration Gold by Special Delivery Intensifies Cancer-Killing Radiation Genetically Modified Salmonella Can Help Kill Cancer Cells Cancer Virology Researchers Reveal New Pathway That Controls How Cells Make Proteins One Type of Airway Cell Can Regenerate Another Lung Cell Type A New Tool for Understanding ALS: Patients' Brain Cells Encapsulated Stem Cells Accelerate Wound Healing Scientists Visualize Potential Brain Cancer Treatments in Real Time with Nanotechnology New Study Could Hold Key to Control Growth of Cancer Cells Stem Cell Disease Model Clarifies Bone Cancer Trigger Gut Instinct: How Intestinal Stem Cells Find Their Niche Amniotic Stem Cells Demonstrate Healing Potential A Digital Field Guide to Cancer Cells Team Discovers Novel Mechanism Controlling Lung Cancer Stem Cell Growth Common Cancers Highjack Powerhouses of Cells Age-Discrimination During Cell Division Maintains the 'Stem' in Stem Cells New Way to Sort Cells Without Limitations of Traditional Methods Cells Exercise Suboptimal Strategy to Survive New Advancements in 3D Designs for Neural Tissue Engineering Device Extracts Rare Tumor Cells Using Sound Mitochondria Are Altered in Human Cell Model of Parkinson's Disease Protein Determines Life or Death Fate of Stressed Cells Researchers Identify "Beige" Fat-Burning Cells in Humans Microsecond Raman Imaging Might Probe Cells, Organs for Disease Premature Aging of Stem Cell Telomeres, Not Inflammation, Linked to Emphysema MRI Based on a Sugar Molecule Can Tell Cancerous From Noncancerous Cells Specific Roles of Adult Neural Stem Cells May Be Determined Before Birth A Single Gene Turns Colorectal Cancer Cells Back Into Normal Tissue in Mice Scientists Identify Progenitor Cells for Blood and Immune System Using Stem Cell Exosomes to Induce Damaged Mouse Hearts to Repair Themselves Without Stem Cell Risk Protein Plays Unexpected Role in Embryonic Stem Cells Disabling Infection-Fighting Immune Response Speeds Up Wound Healing in Diabetes Gene Therapy Prevents Parkinsons Disease in Animal Model, Says Pitt Study Researchers Develop New Technique for Modeling Neuronal Connectivity Using Stem Cells Penn Researchers Show How Cells Solve Biochemical Challenges as They Get Bigger Help Pitt Researchers Keep Organs Alive for Transplantation Osteosarcoma: What Is It and How Is It Treated? Hyperbaric Oxygen Therapy for Wound Healing Dendritic Cells of Elite Controllers Able to Recognize, Mount Defense Against HIV Researchers Devise a Better Way to Potentially Avert Blindness Certain Donors with High T Cell Counts Make a Better Match for Stem-Cell Transplant Patients, Penn Study Suggests Researchers Identify Patients at Risk for Stem Cell Transplant Complications Genomic Catastrophe' May Cause Normal Cells to Become Cancerous Rabbit Virus Improves Bone Marrow Transplants, Kills Some Cancer Cells Autologous Stem Cell Therapy Helpful in Traumatic Brain Injury New Model, New Choices for Wound Healing Using Electrical Fields Human Stem Cell Model Reveals Molecular Cues Critical to Neurovascular Unit Formation How Dividing Cells End Up the Same Size You're As Old As Your Stem Cells Penn Researchers Home In on What's Wearing Out T Cells Tough Biogel Structures Produced By 3-D Printing Study Identifies Possible Role for Carbon Monoxide in Treating Hemorrhagic Stroke Non-Aqueous Solvent Supports DNA Nanotechnology Zebrafish Model Gives New Insight on Autism Spectrum Disorder Tiny Spheres of Human Cells Mimic the Brain, Researchers Say Researchers Identify Origin of Chromosomal Oddity in Some Cancer Cells Regenerating Diminished Skeletal Muscle Tissue Lower Birth Weight Associated with Proximity of Mothers Home to Gas Wells Designing 3D-Printed Materials to Help the Body Heal Itself Stem Cell and Epigenetic Strategies for Retinal Repair Computer Simulation Accurately Replicated Real-Life Trauma Outcomes Statistical Approach Able To Pinpoint Real from Artifact Alerts Designing a Synthetic Gel that Changes Shape and Moves via Its Own Internal Energy Massive Weight Loss Surgery Highlighted Study Adds Evidence on Link Between PTSD, Heart Disease Mount Sinai Researchers Discover Genetic Origins of Myelodysplastic Syndrome Using Stem Cells How the Human Immune System Keeps TB at Bay Novel Nanoparticle Therapy Promotes Wound Healing Common Bacteria on Verge of Becoming Antibiotic-Resistant Superbugs Brain Tumor Cells Decimated by Mitochondrial "Smart Bomb" TSRI Team Discovers Enzyme That Keeps Blood Stem Cells Functional to Prevent Anemia For Most Children with HIV and Low Immune Cell Count, Cells Rebound After Treatment University of Michigan Scientists Grow First 3D Mini Lungs from Human Stem Cells Gene Therapy Slows Vision Loss in Mouse Models of Retinal Degeneration New Score Predicts Heart Disease and Stroke Risk for Anyone in World Aged Over 40 Study Reveals Functional Heterogeneity of CD4 T Cells in Immune Systems Team Finds Key to Making Neurons from Stem Cells Scientists Pinpoint Molecule That Controls Stem Cell Plasticity by Boosting Gene Expression Vitamin D Helps Immune Cells Prevent Atherosclerosis and Diabetes Researchers Identify Protein Needed for Repair of Injured Kidney Cells UT Southwestern Neuroscientists Identify Key Brain Cells That Control Circadian Rhythms Researchers Change Human Leukemia Cells Into Harmless Immune Cells Researchers Find 'Affinity Switch' for Proteasome Assembly Process in Cells When Cancer Cells Stop Acting Like Cancer Donor Supports Research Addressing Dupuytrens Disease Modeling How Cells Move Together Could Inspire Self-Healing Materials New Technique Can Locate Genes' On-Off Switches Researchers Develop 'Warhead' Molecule That Targets Deadly Bacteria, Spares Healthy Cells Study: New Gene Therapy Safe, Effective for Patients with Hemophilia B Stem Cells Lurking in Tumors Can Resist Treatment Boosting a Natural Protection Against Alzheimer's Disease Immune System-in-a-Dish Offers Hope for 'Bubble Boy' Disease Scientists Show Proteins Critical in Day-Night Cycles Also Protect Cells from Mutations New Class of Drugs Dramatically Increases Healthy Lifespan, Mouse Study Suggests High-End Imaging: New Blending Techniques Magnetic Nanoparticles Could Allow Brain Stimulation Without Wires Why Do Cells Rush to Heal a Wound? Mysteries of Wound Healing Unlocked Rett Syndrome May Result from Overexpression of Long Genes Novel Drug Candidate Regenerates Pancreatic Cells Lost in Diabetes First Look at Hospitalized Ebola Survivors' Immune Cells Could Guide Vaccine Design New Protein Booster May Lead to Better DNA Vaccines and Gene Therapy Under Our Nose: Supplemental Oxygen Can Make Tumors Shrink, Says New Study Researchers Identify Genes Responsible for Lung Tumors New Nanodevice Defeats Drug Resistance: Tiny Particles Embedded in Gel Can Turn Off Drug-Resistance Genes, Then Release Cancer Drugs Restoring Ability to Halt Cell Division May Protect Lung Cells from Cancer Researchers Identify Protein Pathway Involved in Brain Tumor Stem Cell Growth Yale Researchers Reverse Type 2 Diabetes and Fatty Liver Disease in Rats Small Molecule Helps Get Stem Cells to Sites of Disease and Damage Do Genes Play a Role in Peanut Allergies? New Study Suggests Yes Neurons Controlling Appetite Made From Skin Cells Asian Herb Holds Promise as Treatment for Ebola Virus Disease Growth Signal Can Influence Cancer Cells' Vulnerability to Drugs, Study Suggests HIV Controls Its Activity Independent of Host Cells Widely Used Food Additives Promotes Colitis, Obesity, and Metabolic Syndrome, Shows Study of Emulsifiers New TSRI Study Shows Safer Methods for Stem Cell Culturing Immune Cells: Learning From Experience Researchers Identify Gene That Pushes Normal Pancreas Cells to Change Shape Dental Researcher Demonstrates How T Cells Cause Inflammation During Infections Vision Loss Reversed in People with Diabetic Eye Disease Researchers Find Drugs Are Effective for Diabetic Macular Edema in New Trial New Nanogel for Drug Delivery: Self-Healing Gel Can Be Injected Into the Body and Act as a Long-Term Drug Depot Proteins Pull Together as Cells Divide Development of Personalized Cellular Therapy for Brain Cancer Epigenome of More Than 100 Tissue and Cell Types Mapped Human Neural Stem Cells Restore Cognitive Functions Impaired by Chemotherapy Study Reports New Gene Therapy Approach Ingredient in Olive Oil Kills Cancer Cells with Their Own Enzymes Bioresorbable Metals in Regenerative Medicine Pitt Collaborates with Janssen to Study and Tailor New Treatments for Inflammatory Bowel Disease From Bench to Bedside: Technology Developed by McGowan Faculty Used in Clinical Setting Physical Therapy, Surgery Produce Same Results for Stenosis in Older Patients A Strategy for Stimulating Heart Muscle Regeneration in Infants, Study Finds Vanderbilt and Pittsburgh to Lead New Center to Identify Toxic Chemicals Catching and Releasing Tiny Molecules McGowan Institute for Regenerative Medicine: 2015 Annual Scientific Retreat Rebooting Cell Programming Can Reverse Liver Failure Early Retina Cell Changes in Glaucoma Identified One-Two Punch Catches Cancer Cells in Vulnerable State Engineers Put the 'Squeeze' on Human Stem Cells How Tumor-Causing Cells Are Recruited in Cancers Linked to Chronic Inflammation Researchers Uncover Signal That Switches Cells to Cancerous Metabolism Akt Pathway 'Ramp Ups' Effects of Transplanted Umbilical Cord Cells Used in Stroke Therapy Light-Activated Genes Might Be Precisely Controlled and Targeted New Study Sheds Light on Cancer Stem Cell Regulation New Source of Cells for Modeling Malaria Study Highlights Brain Cells' Role in Navigating Environment Study Ties Immune Cells to Delayed Onset of Post-Stroke Dementia A Few Cells Could Prevent Bone Marrow Transplant Infections New Nanoparticle Gene Therapy Strategy Effectively Treats Deadly Brain Cancer in Rats Serendipity Leads to Discovery of Adult Cancer Genes in Young-Adult Ewing Sarcoma New Study Shows How Immune Cells Hone Their Skills to Fight Disease Latent HIV May Lurk in 'Quiet' Immune Cells, Research Suggests Researchers Identify Molecular Mechanisms That Can Prevent Blindness, Promote Recovery from Stroke New Cancer-Fighting Strategy Would Harden Cells to Prevent Metastasis Common Degenerative Eye Disease May Be Triggered by Tiny Mineral Deposits Green Tea Ingredient May Target Protein to Kill Oral Cancer Cells New Cells May Help Treat Diabetes Using Stem Cells to Grow New Hair Penn Dental Medicine Team Shows Why Wound Healing Is Impaired in Diabetics Prostate Cancer: Androgen Receptor Activates Different Genes When Bound to Antiandrogens Rare Neurological Disease Shines Light on Health of Essential Nerve Cells Telomere Extension Turns Back Aging Clock in Cultured Human Cells, Study Finds Genome-Wide Search Reveals New Genes Involved in Long-Term Memory Genes Linked to Brain Size May Help Explain Some Neurological Diseases Rice Researchers Develop New Version of Hydrogel to Promote Wound Healing Stem Cell Transplantation Shows Potential for Reducing Disability in Patients with Multiple Sclerosis Gene Therapy-Associated Cancer Incidence Depends on Vector Design Environment, Not Genes, Dictates Human Immune Variation, Research Finds Scientists Use 'Nanovelcro' and Temperature Control to Extract Tumor Cells from Blood Scientists Discover Gene Tied to Profound Vision Loss New Insight That 'Mega' Cells Control the Growth of Blood-Producing Cells Immune Cells May Help Treat Muscular Dystrophy, UCSF-Led Team Finds Personalized Cellular Therapy Achieves Complete Remission in 90 Percent of Acute Lymphoblastic Leukemia Patients Studied Pitt to Lead $14M National Trial Comparing Approaches to Treat Back Pain, Avoid Surgery CMUs Biomedical Engineering Department to Create Heart Science Program Neuroprotecting and Repairing Injured Retina and Optic Nerve with ECM Stem Cells from Wisdom Teeth Can Be Transformed into Corneal Cells Metabolic Disorder Treatment Through Liver Cell Transplant Enterovirus D68 Seen in Cancer, Stem Cell Transplant Patients Researchers Identify That OCR Stem Cells Can Regenerate Bone and Cartilage in Mice Vaccine-Induced CD4 T Cells Have Adverse Effect in a Mouse Model of Infection Nanopore Device Allows for Manipulation of Differentiating Stem Cells Study IDs Two Genes That Boost Risk for Post-Traumatic Stress Disorder Mechanical Stress Produces Stem-Like Cells Via Nontoxic Method HIV Vaccines Should Avoid Viral Target Cells, Primate Model Study Suggests Immune Cells Proposed as HIV Hideout Don't Last in Primate Model Heart Drug May Help Treat Amyotrophic Lateral Sclerosis, Mouse Study Shows Anti-Cancer Drug Effective Against Common Stem Cell Transplant Complication Molecular Beacons Shine Light on How Cells 'Crawl' Progression of Age-Related Macular Degeneration in One Eye Then Fellow Eye Scientists Discover Hidden Subpopulation of Melanoma Cells New Genome-Editing Technique Enables Rapid Analysis of Genes Mutated in Tumors Scientists Discover Hidden Subpopulation of Melanoma Cells Human Skin Cells Reprogrammed Directly Into Brain Cells Once CD8 T Cells Take on One Virus, They'll Fight Others Too Blind Cave Fish May Provide Insight on Eye Disease and Other Human Health Issues Crystallizing the DNA Nanotechnology Dream First Step: From Human Cells to Tissue-Engineered Esophagus Nanoparticle-Based Photodynamic Therapy to Effectively Kill Deep-Set Cancer Cells In Vivo Pitt Team Developing Technology to Allow Amputees to Feel with Prosthetic Limb, Improving Its Function TissuGlu: First Tissue Adhesive Approved by FDA for Internal Use Erectile Dysfunction Drugs Could Protect Liver from Sepsis-Induced Damage Hacking Fat Cells' Metabolism Does Not Affect Insulin Resistance UCLA Researchers Develop Method That Defines Unique Stages of Reprogramming Skin Cells 'Glowing' New Nanotechnology Guides Cancer Surgery, Also Kills Remaining Malignant Cells Retinal-Scan Analysis Can Predict Advance of Macular Degeneration, Stanford Study Finds New e-Incubator Enables Real-Time Imaging of Bioengineered Tissues in Controlled Unit NSAIDs Prevent Colon Cancer by Inducing Death of Intestinal Stem Cells That Have Mutation New Material Advances Tissue Engineering, Drug Delivery Researchers Use Nanotechnology to Engineer ACL Replacements Research Sheds Light on What Causes Cells to Divide Test Predicts Response to Treatment for Complication of Leukemia Stem Cell Treatment New Way to Turn Genes On Genetically Modified Cells Learn to Fight Mesothelioma Researchers Find Way to Defeat Elusive Target Proteins in Cancer Cells Reprogrammed Cells Grow Into New Blood Vessels Researchers Grow Norovirus in Human Cells Scientists Develop New Way to Study How Human Cells Become Immortal, a Crucial Precursor to Cancer Direct Generation of Neural Stem Cells Could Enable Transplantation Therapy Scientists Find That SCNT Derived Cells and IPS Cells Are Similar Retinal Neuron Survival in Glaucoma Production of Human Motor Neurons from Stem Cells Gaining Speed Researchers Discover New Class of Stem Cells How Cartilage Cells Sense Forceful Injury Scientists Uncover a Role for Carbon Monoxide in Battling Bacterial Infections Team Genetically 'Edits' Human Blood Stem Cells Can Patients With Graves Disease Minimize Their Risk for Developing Thyroid Eye Disease? Cells Identified That Enhance Tumor Growth and Suppress Anti-Cancer Immune Attack Study Shows How Breast Cancer Cells Break Free to Spread in the Body Proteins Drive Cancer Cells to Change States Baby Cells Learn to Communicate Using the Lsd1 Gene Decoding Fat Cells: Discovery May Explain Why We Gain Weight Senescent Cells Play an Essential Role in Wound Healing Yeast Are First Cells Known to Cure Themselves of Prions Blocking Receptor in Brains Immune Cells Counters Alzheimers in Mice, Study Finds Turning Biological Cells to Stone Improves Cancer and Stem Cell Research Penn Vet-Berkeley Study: New Therapy Holds Promise for Restoring Vision Gravity: It's the Law, Even for Cells Work on Key Protein Suggests Ways to Address Wound Healing and Autoimmune Disease Predicting the Storm: Can Computer Models Improve Stem Cell Transplantation? Scientists Uncover Mechanism That Controls the Fitness of Cells, Impacting Aging and Disease Tumor Suppressor Also Inhibits Key Property of Stem Cells Scientists Discover New Properties of Microbes That Cause Common Eye Infection Team Finds Novel Approach to Treating Age-Related Macular Degeneration New Machine-Perfusion Organ Preservation System Keeps Livers Healthier for Transplant Statins Inhibit Spread of Some Cancers in Laboratory Tests Smoking, Alcohol, Gene Variant Interact to Increase Risk of Chronic Pancreatitis Stem Cells Faulty in Duchenne Muscular Dystrophy, Researchers Find New Mechanism that Helps Explain Why Older Patients Develop Lung Fibrosis Discovered Company Spotlight: Procirca Wheelchair-Mounted Mobile Robotic-Assisted Transfer System Project: Create Global Network to Improve Lives of Wheelchair Users New Single-Cell Analysis Reveals Complex Variations in Stem Cells Researchers Pinpoint Chemo Effect on Brain Cells, Potential Link to Autism Cancer Uses Abdominal Stem Cells to Fuel Growth and Metastasis 'Chatty' Cells Help Build the Brain Finding Could Upend Scientific Consensus About When Embryonic Cells Begin Separating Into Cell Types The Role DNA Methylation Plays in Aging Cells Infection-Fighting B Cells Go With the Flow Anti-Cancer Drug Protects Normal Cells from Radiation Damage, Increases Effectiveness of Radiation Therapy A Highly Robust, Efficient Nanoparticle-Based Platform to Advance Stem Cell Therapeutics Snapshot of Funded Research: Highlights for 2014 Novel Biomedical Device Receives Funding Patients Own Stem Cells Could Clear a Cloudy Cornea 'Wound Response' of Cancer Stem Cells May Explain Chemo-Resistance in Bladder Cancer Researchers Recreate Stem Cells From Deceased Patients to Study Present-Day Illnesses Scientists Convert Human Skin Cells Into Sensory Neurons Scientists Identify Bone Cells That Could Help Children Who Need Corrective Facial Surgery Pluripotent Cells Created by Nuclear Transfer Can Prompt Immune Reaction, Researchers Find Panel-Based Genetic Diagnostic Testing for Inherited Eye Disease Proves Highly Accurate Cells' Natural Response to Chronic Protein Misfolding May Do More Harm Than Good Masking HIV Target Cells Prevents Viral Transmission in Animal Model Researchers Identify Protein Key to the Development of Blood Stem Cells Signaling Molecule Crucial to Stem Cell Reprogramming Study Finds Link Between Neural Stem Cell Overgrowth and Autism-Like Behavior in Mice Nanoparticles Get a Magnetic Handle: Glowing Nanoparticles Can Be Manipulated Using Magnetic Fields Study Finds Potential Link Between Breast Cancer Genes and Salivary Gland Cancer Scientists Discover Pain Receptor on T-Cells Memory Loss Associated With Alzheimer's Reversed: Small Trial Succeeds Using Systems Approach to Memory Disorders Scientists Manipulate Split Proteins to Detect Interactions in Living Cells 'Unsung' Cells Double the Benefits of a New Osteoporosis Drug Barcoding Tool for Stem Cells: New Technology That Tracks the Origin of Blood Cells Challenges Scientific Dogma Stochastic Variations of Migration Speed Between Cells in Clonal Populations New Gene Therapy for 'Bubble Boy' Disease Appears Effective, Safe Manipulating Memory with Light: Scientists Erase Specific Memories in Mice Study Reveals How Deadly MERS Virus Enters Human Cells A New Way to Extract Bone-Making Cells from Fat Tissue Researchers Develop Novel Gene / Cell Therapy Approach for Lung Disease Research Shows Viral DNA Infects Cells by Changing From Solid to Fluid-Like State Biomarker for Diabetic Eye Disease BRD4 Protein Appears to Play Key Role in Keeping Stem Cells in Immature "Pluripotent" State Scientists Use Stem Cells to Learn How Common Mutation in Asians Affects Heart Health First-Ever Liver Transplant to Treat AHCY Deficiency Performed Pitt Innovation Challenge Awards Prizes to Creative Thinkers Scientists Identify Key Factor That Maintains Stem Cell Identity Bacterial 'Communication System' Could Be Used to Stop and Kill Cancer Cells Chemists Recruit Anthrax to Deliver Cancer Drugs Cancer Cells Adapt Energy Needs to Spread Illness to Other Organs A Better Way to Track Emerging Cell Therapies Using MRIs Scientists Discover an On/Off Switch for Aging Cells Hey1 and Hey2 Ensure Inner Ear 'Hair Cells' Are Made at the Right Time, in the Right Place Final Pieces to the Circadian Clock Puzzle Found Cells Put Off Protein Production During Times of Stress Combining Antibodies, Iron Nanoparticles, and Magnets Steers Stem Cells to Injured Organs Milestone Reached in Work to Build Replacement Kidneys in the Lab In Directing Stem Cells, Study Shows Context Matters Scientists Identify How Immune Cells Use Two Critical Receptors to Clear Dead Cells from the Body Researchers Measure Stiffness of Membrane Surrounding Red Blood Cells Over Time How to Tell Good Stem Cells from the Bad Scientists Identify Rare Stem Cells That Hold Potential for Infertility Treatments Scientists Map Protein in Living Bacterial Cells Study Discovers New Therapeutic Target for Diabetic Wound Healing 'Prepped' by Tumor Cells, Lymphatic Cells Encourage Breast Cancer Cells to Spread Researchers Find Way to Take Pediatric Patient's Skin Cells Scientists Make Diseased Cells Synthesize Their Own Drug Scientists Call For Investigation of Mysterious Cloud-Like Collections in Cells Gene Clues to Glaucoma Risk Malarias Clinical Symptoms Fade on Repeat Infections Due to Loss of Immune Cells, UCSF-Led Team Finds Attacking a Rare Disease at its Source With Gene Therapy Eye Implant Developed at Stanford Could Lead to Better Glaucoma Treatments Sorting Cells with Sound Waves Scientists Uncover Navigation System Used by Cancer, Nerve Cells First Clinical Trial for New Skin Wound-Healing Compound Is a Success Using Molecular Imaging Probes Diabetic Retinopathy Can Be Detected at Molecular Level Research Shows How Premalignant Cells Can Sense Oncogenesis and Halt Growth Study Shows Native American Ancestry a Risk Factor for Eye Disease Stem Cell Therapies Hold Promise, But Obstacles Remain Gene Therapy Protects Mice from Heart Condition Biologists Reprogram Skin Cells to Mimic Rare Disease Moving Single Cells AroundAccurately and Cheaply Sequencing Immunoglobulin Genes to Detect Residual Traces of Cancer Suspect Gene Corrupts Neural Connections Researchers Review Potential of Adipose-Derived Stem Cells to Improve Nerve Regeneration Genetic Signal Prevents Immune Cells from Turning Against the Body How Breast Cancer Usurps the Powers of Mammary Stem Cells Microchip Reveals How Tumor Cells Transition to Invasion Hippo Pathway Identifies and Prevents Progression of Abnormal Cells into Cancer Scientists Create Computer Algorithm for Cell and Tissue Engineering Bioengineers: Matrix Stiffness Is an Essential Tool in Stem Cell Differentiation Research Findings May Lead to Novel Target for Chemoresistant Cancer Cells An Easier Way to Manipulate Malaria Genes Team Reveals Molecular Competition Drives Adult Stem Cells to Specialize Single-Cell Analysis Holds Promise for Stem Cell and Cancer Research Growing Human GI Cells May Lead to Personalized Treatments Advanced Thin-Film Technique Could Deliver Long-Lasting Medication Master HSF Supports Reprogramming of Normal Cells to Enable Tumor Growth and Metastasis Researchers Discover Universal Molecular 'Flag' That Highlights Critical Genes Beware of Claims About Cosmetic Stem Cells Procedures, Review Says Gene Therapy Boosts Chemotherapy Tolerance and Effectiveness of Medications That Attack Brain Cancer Editing HPV's Genes to Kill Cervical Cancer Cells Cancer Cells Look for a Soft Bed How Ageing Blood Stem Cells Lose Function Sugar Mimics Guide Stem Cells Toward Neural Fate Study Identifies Genes Linked to Breast Cancer in East Asian Women Distinctive Developmental Origin for a Drainage Tube in the Eye Aggressive Tumors Silence Genes That Fight Cancer Investigators Identify Genes That Contribute to Radiation Resistance Scientists Eliminate the HIV Virus from Cultured Human Cells for First Time Iodine May Alleviate Swelling in Retinitis Pigmentosa Patients' Retinas Target Growth-Driving Cells Within Tumors, Not Fastest-Proliferating Cells Gene Changes in Breast Cancer Cells Pinpointed with New Computational Method Stem Cells Aid Muscle Repair and Strengthening After Resistance Exercise Researchers Create New Method to Draw Molecules from Live Cells Neurons, Brain Cancer Cells Require the Same Little-Known Protein for Long-Term Survival Cells Protective DNA Linked to Size of Brain Region Vital For Memory Scientists Find Genetic Recipe to Turn Stem Cells to Blood Diagnosing Type 1 Diabetes with Nanotechnology Stem Cell Scientists Lay a TRAP for Disease Acute Glaucoma Discovered to Be an Inflammatory Disease Stem Cell Researcher Targets the 'Seeds' of Breast Cancer Metastasis New Gene Therapy May Be Effective for Fighting Fungal Infections in Cancer Patients Researchers Regrow Human Corneas: First Known Tissue Grown From a Human Stem Cell Discovery May Make it Easier to Develop Life-Saving Stem Cells Transplantation of New Brain Cells Reverses Memory Loss in Alzheimer's Disease Model Patient-Specific Stem Cells and Personalized Gene Therapy Human Cells' Protein Factory Has an Alternate Operating Manual Some Stem Cell Methods Closer to 'Gold Standard' Than Others Research Team Pursues Techniques to Improve Elusive Stem Cell Therapy The Social Psychology of Nerve Cells: Researchers Explore the Genetic Underpinnings of Nerve-Cell Spacing Scientists Find Potential New Use for Cancer Drug in Gene Therapy for Blood Disorders Glaucoma Drug Helps Restore Vision Loss Linked to Obesity Stem Cells May Be More Widespread and With Greater Potential Than Previously Believed Taking Immune Cells for a Test Drive An Equation to Describe the Competition Between Genes Cancer Cells Don't Take 'Drunken' Walks Through the Body Scientists 'Herd' Cells in New Approach to Tissue Engineering Biomolecular Tweezers Facilitate Study of Mechanical Force Effects on Cells and Proteins Several FDA-Approved Anti-Cancer Drugs Induce Stem Cell Tumors, Perhaps Thwarting Therapy Researchers Identify Candidate Genes Associated With Free Radicals Alzheimers Research Team Employs Stem Cells to Understand Disease Processes and Study New Treatments Going Viral to Target Tumors Researchers Identify Genes That Appear to Predict Tumors That Can Evade Detection by Immune System Stem Cell Advance Yields Mature Heart Muscle Cells Motion-Sensing Cells in the Eye Let the Brain Know About Directional Changes How Cancer Cells Metastasize Into Brain Tumors Novel Technique for Cell Lineage-Specific Gene-Expression Analysis Cancer Vaccine Could Use Immune System to Fight Tumors Team Discovers Stem Cells in the EsophagusCould Lead to New Models to Study Esophageal Disease Creating Medical Devices with Dissolving Metal Pitt School of Dental Medicine Team Awarded $2 Million NCI Grant to Study How Cancer Spreads to Bone Pitt Gets $11 Million from NIH to Lead Center of Excellence in National Big Data Research Consortium Pittsburgh Pediatric Mechanical Cardiopulmonary Support Reaches to Florida $1.25 Million Received from Defense Department to Make Whole-Eye Transplantation a Reality New Processes Could Provide Personalized Pain Treatment Unraveling Traumatic Brain Injuries UPMC Voice Center: A Unique Resource Dr. Andrew Duncan Receives NIH Grant Focused on Obtaining a Better Understanding of Liver Biology Pitt, Carnegie Mellon Engineers Develop New Method to Explore Mechanical Communication Between Cells Needle Treatment for Glaucoma Shows Promise: A Monthly Injection That Might Replace Eye Drops Used Twice Daily Dr. John Kellum Helps Develop New Kidney Test Genetic Discovery Yields Prostate Cancer Test, Promise of Future Therapy Dr. Keith Cook to Develop Artificial Lungs that Can Be Worn at Home Study Findings Could Lead to Improved Treatments for Stroke, Other Brain Injuries Dr. Ipsita Banerjee Receives NSF Grant Older Adults with Depression and Mild Cognitive Impairment Are More Vulnerable to Accelerated Brain Aging Pitt/Industry Partnership Helps Students Develop Ideas and Products Surgical Adhesive Technology Receives FDA Panel Recommendation Clinical Imaging in Regenerative Medicine McGowan Institute for Regenerative Medicine Collaborators Create Nanofibers Using Unprecedented New Method Surgical, Other Advances Improve Graft Survival of Intestinal, Multi-Visceral Transplant Patients First Regenerative Medicine Summer School Week The Charles E. Kaufman Foundation Awards Funds to McGowan Institute Affiliated Faculty for Scientific Studies Study Suggests Cystic Fibrosis is Two Diseases, One Doesnt Affect Lungs Research Sheds Light on Nerve Regeneration Following Spinal Cord Injury First Class 1 Evidence for Cognitive Rehabilitation in MS Therapy Using Stem Cells, Bone Marrow Cells, Appears Safe for Patients with Ischemic Cardiomyopathy Protein Shed by HIV-Infected Brain Cells Alters Synaptic Connections Between Networks of Nerve Cells Deletion of Any Single Gene Provokes Mutations Elsewhere in the Genome Study Shows Decrease in Sepsis Mortality Rates Gut Microbes in Healthy Kids Carry Antibiotic Resistance Genes Healthy Stem Cells Can Create Benign Tumors in Jaw, USC Study Finds How Body Clock Affects Inflammation: Discovery Could Accelerate Body's Response to Infection, Autoimmune Disorders New Strategy Could Uncover Genes at the Root of Psychiatric Illnesses Master Switch For Myelination in Human Brain Stem Cells Is Identified American Academy of Ophthalmology Does Not Recommend Marijuana for Glaucoma Treatment Notorious Pathogen Forms Slimy 'Streamers' to Clog Up Medical Devices Immune Cells Found to Prevent Bone Marrow Transplant Rejection New Study Advances Safety, Efficacy Profile of Virus-Specific T Cells for Post-Transplant Recipients NSF Funding For Nanotechnology Bladder Cancer Detection Device Sensor in Eye Could Track Pressure Changes, Monitor for Glaucoma Biologists Find 'Missing Link' in the Production of Protein Factories in Cells Scientists Identify Link Between Stem Cell Regulation and the Development of Lung Cancer Vaccine 'Reprograms' Pancreatic Cancers to Respond to Immunotherapy Gut Bacteria Predict Survival after Stem Cell Transplant, Study Shows Stem Cells in Neurodegeneration: Challenges and Future Neurotherapeutic Prospects Penn Study Describes New Models for Testing Parkinson's Disease Immune-Based Drugs Embryonic Stem Cells Offer Treatment Promise for Multiple Sclerosis Insulin's Risks as Second-Line Medicine to Treat Type 2 Diabetes Dormant Viruses Re-Emerge in Patients with Lingering Sepsis, Signaling Immune Suppression Viral Infections, Including Flu, Could Be Inhibited by Naturally Occurring Protein MRI Brain Scans Detect People with Early Parkinson's TB Dogma Upended: Even Uninfected Cells Trigger Immune Defenses Researchers Use Human Stem Cells to Create Light-Sensitive Retina in a Dish Scientists Use Stem Cells to Create HIV Resistance Protein That Keeps Blood Stem Cells Healthy as They Age Identified by Researchers Nanotechnology Researchers Develop 'Onion' Vesicles for Drug Delivery Fasting Triggers Stem Cell Regeneration of Damaged, Old Immune System Making Artificial Vision Look More Natural Short Nanotubes Target Pancreatic Cancer Transplanted Fetal Stem Cells for Parkinson's Show Promise Four New Genes Confirmed to Increase Familial Breast Cancer Risk Coaxing iPS Cells to Become More Specialized Prior to Transplantation Cuts Rejection Risk, Study Shows For the First Time in the Lab, Researchers See Stem Cells Take Key Step Toward Development Findings Have Important Implications for Improving War Wound Healing Researchers Use Light to Coax Stem Cells to Repair Teeth Naturally Occurring Antibodies May Be Treatment for BK Nephropathy in Kidney Transplant Patients From Stem Cells, New Roots Pitt Researchers Receive $2.1 Million to Study Prevention of Deadly Lung Injury Stem Cells Hold Keys to Body's Plan Gene Therapy Combined with IMRT Found to Reduce Recurrence for Select Prostate Cancer Patients Neuron Tells Stem Cells to Grow New Neurons Stem Cell Therapy May Help Recondition Lungs Previously Rejected for Transplant Team Highlights New Mechanism Explaining How Cancer Cells Spread Scientists Discover Potential New Target for Cancer Immunotherapy DNA Nanotechnology Places Enzyme Catalysis Within an Arm's Length Study Identifies How Signals Trigger Cancer Cells to Spread Researchers Profile Active Genes in Neurons Based on Connections Watching HIV Bud from Cells: Study Shows Last-Minute Role of Protein Named ALIX Pitt Study Shows for First Time How Huntingtons Disease Protein Could Cause Death of Neurons New Study Identifies Heart-Specific Protein That Protects Against Arrhythmia Breakthrough in HIV/AIDS Research Gives Hope for Improved Drug Therapy Herpes-Loaded Stem Cells Used to Kill Brain Tumors B Cells Produce Antibodies 'When Danger Calls, But Not When it Whispers,' Scientists Report Ophthalmology Studies Focus on Glaucoma Medication Adherence Enzyme Helps Stem Cells Improve Recovery from Limb Injuries An Eye Toward Better Treatment BYU Researchers Create Tiny Nano-Device in Newest Gene Therapy Advance Engineers Fabricate Microscale Silk Proteins Patterns for Use in Tissue Engineering and 'Green Devices' Potential Therapeutic Target for Wound-Healing and Cancer Identified Patient Stem Cells Used to Make 'Heart Disease-on-a-Chip' New Nanotechnology Method Sneaks Drugs into Cancer Cells Before Triggering Release NIH Study Demonstrates That a New Cancer Immunotherapy Method Could Be Effective Against a Wide Range of Cancers Scientists Decode Epigenetic Mechanisms Distinguishing Stem Cell Function and Blood Cancer Ovarian Cancer Cells Are More Aggressive on Soft Tissues Spurt of Heart Muscle Cell Division Seen in Mice Well After Birth: Implications for Repair of Congenital Heart Defects Study Confirms Clinical Benefit for Interleukin-2 Immunotherapy in Patients with Advanced Kidney Cancer Stem Cells Could Be the Answer for Treating Fecal Incontinence After Injury or Disease Discovery Helps Explain How B Cells Adapt to Their Targets A Transcription Factor Called SLUG Helps Determines Type of Breast Cancer Human Fat: A Trojan Horse to Fight Brain Cancer? Technology Developed by McGowan Faculty Permitted the First U.S. Implant of a Medical Device Before Lifesaving Double Lung Transplant Pitts Center for Medical Innovation Awards 2014 Round-1 Pilot Funding Deep Brain Stimulation for Parkinsons Disease Mouse Study Offers New Clues to Cognitive Decline Mitochondrial Deficits in Children with Autism Confirmed Universal Neuromuscular Training an Inexpensive, Effective Way to Reduce ACL Injuries in Athletes Physicists Working to Cure 'Dry Eye' Disease Researchers Identify How Heart Stem Cells Orchestrate Regeneration Reijo Pera and Team: Stem Cell Research Holds Promise for Male Infertility Brain Tumor Cells Penetrated by Degradable Nanoparticles Carrying Genetic Instructions Overlooked Cells Hold Keys to Brain Organization and Disease A Civil War Inside Our Cells: Scientists Show How Our Bodies Fight Off 'Jumping Genes' Cells Are More Resilient Than Originally Thought, Say Scientists Bio-Engineers Grow Functional Human Cartilage in Vitro Team Reprograms Blood Cells into Blood Stem Cells in Mice Stem Cells in Circulating Blood Affect Cardiovascular Health, Study Finds Nanotechnology Researchers Demonstrate Potential of RNA as Heat-Resistant Polymer Material for Nanoarchitectures Cancer Stem Cells Linked to Drug Resistance Researchers Discover How Intestinal Cells Build Nutrient-Absorbing Surface Some Immune Cells Defend Only One Organ Engineering Cell-Based, Biological Devices May Selectively Kill Cancer Cells Without Disrupting Healthy Cells Hydrogen Sulfide Regulates Bone Marrow Mesenchymal Stem Cells, Shows Study $2.9 Million Grant to Improve Brain Implants Received McGowan Institute Medical Device Technology Receives Gold Medical Design Excellence Award Efficient Analysis of Small Quantity of Cells Improves Chances to Understand Disease Engineers Help Make Advances in Virtual Artificial Heart Implantation Discovery Could Have Far-Reaching Implications for Diagnosis and Treatment of Diabetic Retinopathy Research Reveals Evolution of Cells' Signaling Networks in Diverse Organisms Modified Stem Cells Offer Potential Pathway to Treat Alzheimer's Disease New Technique of Single-Cell Genomic Analysis to Reverse Tissue Engineering New Method Isolates Immune Cells for Researchers to Study How They Ward Off Oral Diseases Nanotechnology Unlocks New Pathways for Targeted Drug Delivery How a Silly Putty Ingredient Could Advance Stem Cell Therapies Laboratory-Grown Vaginas Implanted in Patients, Scientists Report Dr. Anna Balazs Work Featured on the Cover of Journal of Physical Chemistry Letters Dr. Juan Carlos Puyana to Share $1.6M Grant Team Solves Decades-Old Mystery of How Cells Keep From Bursting Surface-Modified Nanocellulose Hydrogels for Wound Dressing Researchers Identify Transcription Factors Distinguishing Glioblastoma Stem Cells Too Much Protein May Kill Brain Cells as Parkinson's Progresses Detecting Infection with a Microchip Researchers Show How Cancer Cells May Respond to Mechanical Force Bone Marrow Stem Cells Show Promise in Stroke Treatment Study Provides Insights into Why Alcohol Has Negative Effect on Wound Healing Researchers Develop Technique to Measure Quantity, Risks of Engineered Nanomaterials Delivered to Cells Tumor Suppressor Gene Linked to Stem Cell Function Some Breast Cancer Tumors Hijack Patient Epigenetic Machinery to Evade Drug Therapy Stem Cell-Derived Beta Cells Under Skin Replace Insulin First Stem Cell Study of Bipolar Disorder Yields Promising Results Stem Cell Findings May Offer Answers for Some Bladder Defects and Disease A New Way to Make Muscle Cells from Human Stem Cells Proteins That Control Energy Use Necessary to Form Stem Cells Study Identifies DNA Region Linked to Severity of Herpes Simplex Infections Study Finds Stem Cell Combination Therapy Improves Traumatic Brain Injury Outcomes Study Finds That Fast-Moving Cells in the Human Immune System Walk in a Stepwise Manner Department of Defense Peer Reviewed Medical Research Program Funding Received Regenerative Medicine Improves Muscle Strength and Function in Leg Injuries Cartilage, Made to Order: Living Human Cartilage Grown on a Lab Chip Non-Invasive Imaging of the In Situ Restoration of Brain Tissue Malfunction in Molecular Proofreader Prevents Repair of UV-Induced DNA Damage Metabolic Profiling of Liver Cells Suggests New Treatments for Cirrhosis Patients Key Heart Failure Culprit Discovered in Tiny Piece of RNA Finding Hiding Place of Virus Could Lead to New Treatments Stem Cell Study Opens Door to Undiscovered World of Biology Aged Mice Lacking Antioxidant Protein Nrf2 Show Poor Stem Cell Regeneration Diabetes Researchers Track Cells' Ability to Regenerate UV Light Accelerates Cancer Cells That Creep Along the Outside of Blood Vessels Cellular Alchemy: How to Make Insulin-Producing Cells from Gut Cells Using Nanotechnology to Improve the Speed, Efficiency, and Sensitivity of Biosensors Alzheimers in a Dish Tumor Cells - Finding a Few Foes Among Billions of Cellular Friends Nanoparticles and Magnetic Fields Train Immune Cells to Fight Cancer in Mice Scientists Transform Skin Cells Into Functioning Liver Cells New Nanotechnology Method to Fight Cancer with Tissue-Penetrating Light High-Calorie Diet Could Slow Progression of Motor Neuron Disease (ALS), Study Finds Watching How the Brain Works With New Live Imaging First Look at How Individual Staphylococcus Cells Adhere to Nanostructures Could Lead to New Ways to Thwart Infections Imaging Dynamics of Small Biomolecules Inside Live Cells It Slices, It Dices, and It Protects the Body from Harm: 3-D Structure of Enzyme That Helps Defend Against Bacteria Promising Results with Local Hyperthermia of Tumors Prenatal Nicotine Exposure May Lead to ADHD in Future Generations Fragile X Syndrome: Trigger For Most Common Form of Intellectual Disability and Autism Uncovered Novel Therapeutic Targets for Huntington's Disease Discovered Causal Link Found Between Vitamin D, Serotonin Synthesis, and Autism in New Study New Clues Found to Prevent Lung Transplant Rejection Animal Cells Can Communicate by Reaching Out and Touching, Team Discovers Two Players Produce Destructive Cascade of Diabetic Retinopathy Designer 'Swiss-Army-Knife' Molecule Captures RNA in Single Cells in Their Natural Tissue Environment Study Identifies Population of Stem-Like Cells Where HIV Persists in Spite of Treatment Red Blood Cells Take on Many-Sided Shape During Clotting Harvard Scientists Control Cells Following Transplantation, From the Inside Out Stem Cell Research Identifies New Gene Targets in Patients with Alzheimer's Disease Color-Coded Cells Reveal Patchwork Patterns of X Chromosome Silencing in Female Brains Stem Cells Used to Model Disease That Causes Abnormal Bone Growth Scientists Make Living Brain Cells from Alzheimer's Patients Biobanked Brain Tissue Biomaterials Get Stem Cells to Commit to a Bony Future Researchers Target Cancer Stem Cells in Malignant Brain Tumors Researchers Gain Insight Into Retinal Detachment After Open Globe Injury Biologists Discover Solution to Problem Limiting Development of Human Stem Cell Therapies Study Finds Patients Give Broad Endorsement to Stem Cell Research Novel Noninvasive Therapy Prevents Breast Cancer Formation in Mice Researchers Fast-Forward Stem Cell Aging to Study Degenerative Diseases Tufts Researchers Identify Potential Topical Treatment for Macular Degeneration Platelet-Rich Plasma and Fat Grafting: An Option? Model-Based Decisions in Sepsis (MODS) The Whole Liver Replacement State-of-the-Science Summit Integrating Mental Health Services in Pediatric Practices Feasible, Effective, Pitt Finds Lifestyle Interventions Can Prevent Major Depression in Older Black and White Adults with Mild Symptoms Designing Better Vascular Grafts Turings Theory of Morphogenesis Validated 60 Years After His Death Exploring 3-D-Printed Bone and Tissue Scaffolds Pitt/MWRI Researchers Awarded Prestigious Cozzarelli Prize for Top Biomedical Sciences PNAS Paper of 2013 Study Challenges Accepted Sepsis Treatment Stem Cells from Muscle Can Repair Nerve Damage After Injury Lizards May Answer Cartilage Regeneration Mystery Biomarkers That Can Provide Advance Warning of Deadly Kidney Condition in Critically Ill Patients Identified Innovative Brain Imaging Technology Receives DSF Charitable Foundation Funding Autophagy Predicts Which Cancer Cells Live and Die When Faced With Anti-Cancer Drugs Draper Nanotechnology Could Fight Influenza, Other Viruses Stimulating Brain Cells Stops Binge Drinking, Animal Study Finds Gene Therapy Method Targets Tumor Blood Vessels Common Disorders: Its Not the Genes Themselves, But How They Are Controlled Adult Stem Cells Found to Suppress Cancer While Dormant New Data for Engineering Immune Cells Shows Promise in Solid Tumors Early Detection of Blinding Eye Disease Could be as Easy as Scanning a Barcode New - and Reversible - Cause of Aging: Naturally Produced Compound Rewinds Aspects of Age-Related Demise in Mice How Cells Remodel After UV Radiation Researchers Generate Kidney Tubular Cells From Stem Cells Scientists Discover How Immune Cells Die During HIV Infection; Identify Potential Drug to Block AIDS Mouse Study Shows Potential for Gene Therapy in Alport Syndrome, an Inherited Kidney Disease Stem Cells Offer Clues to Reversing Receding Hairlines Microprinting Leads to Low-Cost Artificial Cells New Delivery Vehicle Developed For Gene Therapy Stem Cell Research Uncovers Importance of Cell Cycle Activated Killer T-Cells Effective Against Resistant Lymphoma Lung Lesions of TB Variable, Independent Whether Infection is Active or Latent, Says Pitt Study Team Finds Potential Treatment for Skin and Corneal Wound Healing in Diabetics UCLA Stem Cell Researchers Track Early Development of Human Articular Cartilage Salmonella Jams Signals From Bacteria-Fighting Mast Cells Tumor-Suppressing Genes Could Play Important Role in Obesity, Diabetes, and Cancer Brain Cancer Cells Hide While Drugs Seek Type 1 Diabetes: A Treatment's in Sight? Precise Electronic Drug Release Thanks to Graphene Oxide Nanocomposite Material Small Blood Pumps for Small Patients Funding Awards for New Biomedical Technology Announced Mood-Stabilizing Drug Could Be New Treatment for Inherited Liver Disease Pioneering Initiative = Improved Standard of Care + Educational Success Pitt Establishes Brain Institute to Unlock Mysteries of the Brain, Discover Novel Therapies Pennsylvanias First Minimally Invasive Heart Pump Implant New Research Implicates Immune System Cells in Muscle Healing New Gene Therapy Targets Hemophilia Brain's Never-Before-Seen Cellular Response to Concussions Could Lead to Therapy Study Finds Biomaterials Repair Human Heart New Sensor Tracks Zinc in Cells Tiny Oil Droplets Help Measure Mechanical Forces Produced by Living Cells That Shape Tissues and Organs New Drug Approach Could Lead to Cures for Wide Range of Diseases Innovative Contact Lens Delivers Glaucoma Medication Continuously PKM2 Protein Controls Mitosis, Saving Cancer Cells from Death and Promoting Brain Tumor Growth Staying Ahead of Huntington's Disease Activating Pathway Could Restart Hair Growth in Dormant Hair Follicles, Penn Study Suggests Gene Therapy Bolsters Enzyme Activity to Combat Alzheimer's Disease in Mice Researchers Discover Early Step in Blood Stem Cell Development Researchers Unlock a New Means of Growing Intestinal Stem Cells Human Stem Cells Converted to Functional Lung Cells Scientists Discover How Leukemia Cells Exploit 'Enhancer' DNA Elements to Cause Lethal Disease Researchers Identify Cells Involved in Placenta Development Nanotechnology Improves Cardiovascular Implant Attachment Researchers at Penn Uncover Mechanism Behind Blood Stem Cells Longevity How Living Cells Solved a Needle in a Haystack Problem to Produce Electrical Signals Gene-Silencing Study Finds New Targets for Parkinson's Disease NIH Mouse Study Finds Gut Microorganisms May Determine Cancer Treatment Outcome B Cells School Gut Microbes Newly Identified Brown Fat Stem Cells Hold Possibilities for Treating Diabetes, Obesity Nanotechnology Technique May Help Diabetics Avoid the Needle Rare Disease Yields Clues About Broader Brain Pathology 'Mini-Kidney' Structures Generated from Human Stem Cells for First Time Drug Shows Early Promise in Treating Seizures Mitochondrial Mystery: Investigating Cells' Power Packs Fuels Understanding of Rare, and Common, Diseases Persistent Gene Therapy in Muscle May Not Require Immunosuppression Understanding a Protein's Role in Familial Alzheimer's Disease New Trigger for Breast Cancer Metastasis Identified Determining Acute Kidney Injury Pitt Study Finds Mechanism for Increased Activity of Oncogene in Head and Neck Cancers Pitt Researchers to Study New Treatments for Pancreatic Cancer Patients Novel Biological Sources for Battery Materials Ballet and Sports Medicine Personalized Medicine for Pancreatic Diseases Regenerative Medicine Partnership with Cornell University New Zero-Dimensional Carbon Nanotube May Lead to Superthin Electronics and Synthetic Cells Muscle Morbidity and Reduced Regenerative Capacity Human Stem Cells Used to Reveal Mechanisms of Beta-Cell Failure in Diabetes New Treatment Discovered to Cure MRSA Infection Novel Gene Therapy Works to Reverse Heart Failure Nanotechnology Researchers Prove Two-Step Method for Potential Pancreatic Cancer Treatment Finding Antitumor T Cells in a Patient's Own Cancer Signal Found to Enhance Survival of New Brain Cells Drug Combination Therapy Causes Cancer Cells to 'Eat Themselves' Stem Cells Linked to Cognitive Gain After Brain Injury in Preclinical Study Novel Nanotechnology Therapeutics Silences Incurable Brain Cancer Gene NIH Funds Researchers Using Light to Control and Monitor Neural Activity Effects of Chronic Stress Can Be Traced to Your Genes Study Finds Molecular Link Between Gut Microbes and Intestinal Health NEJM Study Evaluates Early Stem Cell Transplants For Non-Hodgkin's Lymphoma Researchers Identify Way to Increase Gene Therapy Success Zebrafish Useful Tool in Prostate Cancer Stem Cell Study Yeast, Human Stem Cells Drive Discovery of New Parkinson's Disease Drug Targets Researchers Apply Brainpower to Understanding Neural Stem Cell Differentiation Bioinformatics Breakthrough: High Quality Transcriptome from as Few as Fifty Cells Promising Technique for Treating Eye Disease Proves Effective in Preclinical Studies A New Model For Organ Repair: Kidney Repair May Not Require Stem Cells Proposed: New Composites That Can Regenerate When Damaged Pitt Team Aims to Change Tissue Microenvironment to Fend Off Cancerous Tumors Multicenter, Multidisciplinary Effort to Study Hemorrhaging in Trauma Patients Sensory Substitution Helps the Blind See Compounded Medication to Prevent Preterm Birth Not a Safety Risk Weighing In: Three Years Post-Op Bariatric Surgery Patients See Big Benefits Insights Into Genetic Architecture of OCD, Tourette Syndrome Grafted Limb Cells Acquire Molecular 'Fingerprint' of New Location, Study Shows No Evidence to Support Stem Cell Therapy For Pediatric Optic Nerve Hypoplasia Cells' 'Molecular Muscles' Help Them Sense and Respond to Their Environments Physical Cues Help Mature Cells Revert Into Embryonic-Like Stem Cells Complex Diseases Traced to Gene Copy Numbers Nanotechnology Ovarian Cancer Treatment Succeeds in the Lab Hardening of Arteries in Elderly Adults Linked to Plaques in Brain, Pitt Study Finds Team Takes First Step Toward Macular Dystrophy Gene Therapy Lou Gehrigs Disease: From Patient Stem Cells to Potential Treatment Strategy Nanotech System, Cellular Heating May Improve Treatment of Ovarian Cancer Elusive Secret of HIV Long-Term Immunity Brain Scans May Aid in Diagnosis of Autism Separating the Good from the Bad in Bacteria Individualized Therapy for the Brain Targets Specific Gene Mutations Causing Dementia and ALS New Evidence That Aging Tumor Cells May Be an Effective Cancer Treatment Adult Stem Cells Help Build Human Blood Vessels in Engineered Tissues Database of Disease Genes Shows Potential Drug Therapies Outside Influence: Genes Outside Nucleus Have Disproportionate Effect Stomach Cells Naturally Revert to Stem Cells In Stem Cells, Like Real Estate, Location is Most Important Factor Burn Therapy: An Award-Winning Regenerative Medicine Approach Innate Virus-Killing Power Discovered in Mammals Loss of Anti-Aging Gene Possible Culprit in Age-Related Macular Degeneration Newly Discovered Gene Regulator Could Precisely Target Sickle Cell Disease Genes Protect Themselves Against Being Silenced Single Gene Mutation Linked to Diverse Neurological Disorders Awakening Genes That Suppress Tumors Retinitis Pigmentosa Test Identifies Mutation Found in Ashkenazi Jewish Population Researchers Find Six New Sjogren's Syndrome Genes Cells Prefer Nanodiscs Over Nanorods How JC Polyomavirus Invades Cells Creating 'Re-Specified' Stem Cells for Disease Modeling Gum Disease Treated by Using Homing Beacon to Bring Needed Immune Cells to Inflamed Area Traumatic Brain Injury Research Advances with $18.8M NIH Award Improving the Therapeutic Relevance of Muscle Stem Cells Nano-Dissection Identifies Genes Involved in Kidney Disease Researchers Uncover Keys to Antibiotic Resistance in MRSA Stem Cells Engineered to Become Targeted Drug Factories Scientists Identify 140 Regions of Genetic Code Believed to Contain Undiscovered Cancer Genes Important Wound-Healing Process Discovered Sister Stem Cells Display Considerable Differences Despite Having Identical DNA Novel Drug Prevents Common Viral Disease in Stem-Cell Transplant Patients, Study Finds Setting Blurred Images in Motion Improves Perception iPhones for the Eyes: Smart Phone Photography to Help Diagnose Eye Disease Blocking Nerve Cells Could Prevent Symptoms of Eczema Cell Powerhouses Shape Risk of Heart Disease Cancer Cells Propagated From Early Prostate Cancer Model Developed for Studying Tissue Pattern Formation During Embryonic Development New Approach to Treating Human Brain Cancer Could Lead to Improved Outcomes Nanoparticle Vaccine: Particles That Deliver Vaccines Directly to Mucosal Surfaces Could Defend Against Many Infectious Diseases Genetic Makeup and Diet Interact With the Microbiome to Impact Health Model to Study Human Response to Bacteria That Cause Peptic Ulcers Developed Cancer-Killing Cells Controlled by Epigenetic Process, New Study Shows Signal Gradients in 3-D Guide Stem Cell Behavior Whole DNA Sequencing Reveals Mutations, New Gene for Blinding Disease Depletion of Traitor Immune Cells Slows Cancer Growth in Mice 'Wildly Heterogeneous Genes' Vicious Cycle Shields, Spreads Cancer Cells Researchers Use New Genetic Mapping Technique to Identify Two Genes That Can Cause Vision Loss in Seniors Faulty Stem Cell Regulation May Contribute to Cognitive Deficits Associated With Down Syndrome Stem Cell Transplants May Be a Novel Treatment for Schizophrenia Research Points to Promising Treatment for Macular Degeneration Strategic Partnership in Regenerative Medicine Formed With Instron Study Indicates Benefits of Stem Cells in Treating MS Declines With Donors Age Scientist Identifies Helper Cells That Trigger Potent Responses to HIV Finding Could Potentially Make iPS Cells Safer For Use in Humans Sleep Boosts Production of Brain Support Cells Scientists Pinpoint 105 Additional Genetic Errors That Cause Cystic Fibrosis Unprecedented Control of Genome Editing in Flies Promises Insight Into Human Development, Disease Aggressive Lymphoma: Low Doses of Approved Drug Switches on Pathway That Allows Chemotherapy to Kill Cancer Pitt Scientists Solve Mystery of Basic Cellular Process Entering a New Dimension: 4D Printing Drs. Rubin and Marra Comment on Denmark Stem Cell-Enriched Fat Grafts Clinical Study The Latest Advances in Technology for People with Spinal Cord Injury NSF Grant Explores Materials That Compute Novel Therapeutic Cancer Vaccine Goes to Human Clinical Trials Cell Death Protein Could Offer New Anti-Inflammatory Drug Target First Detailed View of Morphing Parkinson's Protein Revealed Scientists Link a Protein to Initial Tumor Growth in Several Cancers Study Examines Ways to Restore Immunity to Chronic Hepatitis C Infection Molecular Beacons Light Path to Cardiac Muscle Repair An Easier Way to Control Genes Proteins in Histone Group Might Influence Cancer Development, Study Shows New Imaging Technology Promising For Several Types of Cancer Protein That Protects Nucleus Also Regulates Stem Cell Differentiation Scripps Florida Scientists Detail Critical Role of Gene in Many Lung Cancer Cases Scientists Identify Amyotrophic Lateral Sclerosis Disease Mechanism Blocking Molecular Pathway Reverses Pulmonary Hypertension in Rats Model of 'Near-Optimal' Genetic Code Developed Key Enzymes Are Found to Have a 'Profound Effect' Across Dozens of Genes Linked to Autism Butterfly Wings + Carbon Nanotubes = New 'Nanobiocomposite' Material Team 'Spikes' Stem Cells to Generate Myelin A Major Cause of Age-Related Memory Loss Identified: Potentially Reversible Stem Cells May Do Best With a Little Help From Their Friends Hodgkin Lymphoma Treatment Linked to Possible Risk of Stomach Cancer Disabling Enzyme Reduces Tumor Growth, Cripples Cancer Cells, Study Finds Harmonizing a Broken Heart: Stem Cells Keep Cardiac Beat in Synchrony Scientists Uncover How Superbug Fights Off Antibiotic Third Annual Regenerative Rehabilitation Symposium, April 10-11, 2014, San Francisco, California McGowan Institute for Regenerative Medicine to Co-Direct $75 Million Second Phase of National Effort to Aid Wounded Warriors Unusual Combination Therapy Shows Promise for Preventing Prostate Cancer Receptor May Aid Spread of Alzheimer's and Parkinson's in Brain Fetal Stem Cell Transplantation Favorably Impacts Radiation-Induced Cognitive Dysfunction Team Creates Cells That Line Blood Vessels University of Hawaii Cancer Center Researcher Identifies Association Between Healthy Diet and Reduced Risk of Bladder Cancer Therapeutic Eye Injections May Be Needed Less Often Dialing Back Treg Cell Function Boosts Cancer-Fighting Immune Activity Researchers Transform Fluorescent Proteins Into a Scaffold For Manipulating Genes Van Andel Institute Discovery Could Help Diagnose Precursor to Pancreatic Cancer Risk of Dementia Doubles for Elderly Patients Hospitalized with Infections Artificial Cells to Study Effects of Molecular Crowding on Gene Expression Developed Mending a Broken Heart? Scientists Transform Non-Beating Human Cells Into Heart-Muscle Cells Study Helps Explain Increased Risk of Melanoma in People with Red Hair Bacteria Make Us Feel Pain ... and Suppress Our Immune Response In Regenerating Planarians, Muscle Cells Provide More Than Heavy Lifting FDA Approves MSC-NP Therapy as Investigational New Drug in MS Clinical Trial: A Research Milestone Six Months of Fish Oil Reverses Liver Disease in Children with Intestinal Failure, Study Shows New Gene Repair Technique Promises Advances in Regenerative Medicine Rules Governing Expression of Developmental Genes in Mouse Embryonic Stem Cells Are More Nuanced Than Anticipated Nanodrug Targeting Breast Cancer Cells from the Inside Adds Weapon: Immune System Attack Burkitt Lymphoma Survival Improves For Some Helper Cells Aptly Named in Battle with Invading Pathogens Gene Regulator is Key to Healthy Retinal Development and Good Vision in Adulthood Researchers Report a Critical Role for the Complement System in Early Macular Degeneration Writing Rules for Gene-Therapy Vectors: Researchers Compute, Then Combine Benign Viruses to Fight Disease Study Finds New Genes Behind Severe Childhood Epilepsy New Evidence That Cancer Cells Change While Moving Throughout Body Scientists Identify Biomarker to Predict Immune Response Risk After Stem Cell Transplants Type 1 Diabetes Drug Strikingly Effective in Clinical Trial Mechanism That Allows Bacteria to Infect Plants May Inspire Cure for Eye Disease Gut Reaction: Mice Survive Lethal Doses of Chemotherapy Dad's Genes Build Placentas, Study Shows NIH Scientists Visualize How Cancer Chromosome Abnormalities Form in Living Cells Researchers Adapt Microscopic Technology for Bionic Body Parts and Other Medical Devices Making Connections in the Eye: Wiring Diagram of Retinal Neurons is First Step Toward Mapping the Human Brain Stem Cells Found in Gum Tissue Can Fight Inflammatory Disease Study Reveals Genes That Drive Brain Cancer More Intestinal Cells Can Absorb Larger Particles Ultrasound Patch Heals Venous Ulcers in Human Trial UC San Diego Researchers Develop Efficient Model for Generating Human iPSCs Study Findings Offer a Promising New Direction for Organ Regeneration and Tissue Repair Long-Sought Method to Efficiently Make Complex Anticancer Compound Developed New Treatment Strategy for Breast Cancer Spread to Brain Advance in Regenerative Medicine Could Make Reprogrammed Cells Safer While Improving Their Function Burnt Sugar Derivative Reduces Muscle Wasting in Fly and Mouse Muscular Dystrophy UPCI Researchers Target Cell Sleep to Lower Chances of Cancer Recurrence Genetics: More Than Merely a Mutated Gene Inhalable Gene Therapy May Restore Function of Crucial Enzyme to Reverse Deadly PAH Neuroscience Professor Links Diet Deficits to Hyperactivity in Teens Stimulating Brain Cells Can Make False Memories NIH Researchers Discover How Brain Cells Change Their Tune Effects of Purging Tumor Cells from Stem Cells in Patients Transplanted For High-Risk Neuroblastoma Target for Drug Development for Chronic Jaw Pain Disorder Revealed Reprogramming Patients' Cells Offers Powerful New Tool for Studying, Treating Blood Diseases Silky Brain Implants May Help Stop Spread of Epilepsy Stem Cell-Based Epilepsy Approach May Help in Search for Better Medicines to Treat Seizure Disorders Scientists Reach the Holy Grail in Label-Free Cancer Marker Detection: Single Molecules A New Weapon Against Stroke Gene Therapy for Type 1 Diabetes Aims to Eliminate Daily Insulin Injections A Flip of the Mitotic Spindle Has Disastrous Consequences for Epithelial Cells Controlling Genes With Light Researchers Step Closer to Custom-Building New Blood Vessels Decellularized Mouse Heart Beats Again after Regeneration with Human Heart Precursor Cells University of Pittsburgh Cancer Institute International Academy Scholars Present Projects Coulter Foundation Translational Research Partnership Program Invests in 3 Medical Technologies of McGowan Institute for Regenerative Medicine Affiliated Faculty Practice Makes the Brains Motor Cortex More Efficient Light That Moves and Molds Gels Premature Aging of Immune Cells Present in Joints of Kids with Chronic Arthritis NIH Grant to Study Pediatric Traumatic Brain Injuries Received Genetic Glitch at the Root of Allergies Revealed Key Molecular Pathways Leading to Alzheimer's Identified New Research Suggests That Gingival Stem Cells Can be Used in Tissue Regeneration CHOP-Led Research Increases Numbers of Patients Who Could Be Treated with Gene Therapy Scientists Show Proof-of-Principle for Silencing Extra Chromosome Responsible for Down Syndrome Researchers Generate Long-Lasting Blood Vessels from Reprogrammed Human Cells Recycling in the Eye Promotes Good Vision Successful Restoration of Hearing and Balance A Secret to Making Macrophages Gene Mutation Linked to Obesity: Mice Gain Weight Even When Fed Normal Amounts of Food Gold Nanofibers in Engineered Heart Tissue Can Enhance Electrical Signaling Poor Sleep in Pregnancy Can Disrupt the Immune System and Cause Birth-Related Complications, Pitt Study Finds Steering Stem Cells With Magnets: Proof of Concept For Clinical Applications Nanotechnology Drug Crosses Blood-Brain Tumor Barrier, Targets Brain Tumor Cells Interspecies Transplant Works in First Step For New Diabetes Therapy Injecting Iron Supplement Lets Scientists Track Transplanted Stem Cells UNMC Nanotechnology Protects Skin from Cancer and Early Wrinkles Researchers Perform DNA Computation in Living Cells Cell Therapy May Overcome Major Challenges in Organ Transplantations Microparticles Create Localized Control of Stem Cell Differentiation Stem-Cell Therapy for Treatment of Stroke Has Benefits as Well as Risk Nanotechnology Approach Could Lead to 'Artificial Skin' That Senses Touch, Humidity, and Temperature Plant-Made Drug Reverses Breathing Paralysis, Study Suggests Unique Epigenomic Code Identified During Human Brain Development New Approaches to Understanding Infection May Uncover Novel Therapies Against Influenza McGowan Institute for Regenerative Medicine Affiliated Faculty Members Receive Project Funding for Early Stage Medical Technology R&D Artificial Cells to Study Effects of Molecular Crowding on Gene Expression Developed Placental Cells May Prevent Viruses from Passing from Mother to Baby Biomarker Predicts Heart Attack Risk Based on Response to Aspirin Therapy Clues About Autism May Come From the Gut Dissecting the Distinctive Walk of Disease UCLA Stem Cell Gene Therapy For Sickle Cell Disease Advances Toward Clinical Trials Nerve Cells Can Work in Different Ways with Same Result, Says MU Researcher Mimicking Living Cells: Synthesizing Ribosomes A Telescope For the Eye: New Contacts May Improve Sight For Macular Degeneration Patients Researchers Strike Gold With Nanotechnology Vaccine Results of Landmark 11-Year Study on Weight Losss Effect on Heart Disease Risks Published Genes Involved in Birth Defects May Also Lead to Mental Illness Study Sets Guidelines for Stem Cell Transplants in Older Patients with Myelodysplastic Syndromes Nanotechnology Sensor Shows Promise to Detect Disease With Drop of Blood Scientists Use Stem-Cell Technology to Create Research Cell Line From PDAC Patient Stem Cell Patterns in Flies Offer Potential Applications For Human Biologists Research Uncovers Approach That May Decrease Complications of Stem Cell Transplants for Cancer NYSCF and Columbia Researchers Demonstrate Use of Stem Cells to Analyze Causes and Treatment of Diabetes Fingernails Reveal Clues to Limb Regeneration Scientists Coax Brain to Regenerate Cells Lost in Huntingtons Disease Penn Research Shows Way to Improve Stem Cells Cartilage Formation Easy and Effective Therapy to Restore Sight: Engineered Virus Will Improve Gene Therapy for Blinding Eye Diseases Cancer Cells' Appetite for Sugar May Have Serious Consequences for Immune Cell Function Mount Sinai Discovers New Liver Cell for Cellular Therapy to Aid in Liver Regeneration Fat Chance: Scientists Unexpectedly Discover Stress-Resistant Stem Cells in Adipose Tissue Reprogrammed Cells a New Tool in Researching Alzheimer's, Schizophrenia, Autism Big Multiple Sclerosis Breakthrough Stem Cells Show Potential to Treat a Leading Cause of Blindness Growth Factor Responsible For Triggering Hair Follicle Generation During Wound Healing Identified, Found in Cells of Short Supply in Humans Researchers Solve Two Longstanding Challenges in Liver Tissue Engineering Enhanced White Blood Cells Heal Mice with MS-Like Disease New Gene Therapy Shows Broad Protection in Animal Models to Pandemic Flu Strains, Including the Deadly 1918 Spanish Influenza Dendritic Cell Therapy Improves Kidney Transplant Survival in Preclinical Model McGowan Institute Military Medicine-Related Research McGowan Institute for Regenerative Medicine Has a Strong Presence at ASAIO Annual Conference NIH Grant to Improve Treatment of Wet Age-Related Macular Degeneration Received Living Donor Kidney Transplants: Increasing the Number of Kidneys Available for Transplantation How Young Genes Gain a Toehold on Becoming Indispensable Biomarker Could Help Scientists Choose the Right Cell Line When Conducting Stem Cell Experiments Gene Therapy Helps Muscular Dystrophy Patients Breathe Easier Researchers Discover How and Where Breast Tumor Cells Become Dormant and What Causes Them to Become Metastatic Researchers Gain Insight Into Key Protein Linked to Cancers, Neurodegenerative Disorders Adult Stem Cells Combined With New Drug Could Hold Key to Curing Type 1 Diabetes Stem Cell Injections Improve Spinal Injuries in Rats Transplantation of Human Stem Cells Improves Muscle Function in Rats Used to Model ALS Survival Rates Increased Among Patients Who Received Blood Stem Cell Transplants: Study Pitt Researchers Find Immune Cells May Play Previously Unrecognized Role in Inflammation in HIV/AIDS Researchers Coax Clays to Make Human Bone Nerve Stimulation Helps with Overactive Bladder Biologists Take Snapshot of Fleeting Protein Process Pitt-led Team Describes Molecular Detail of HIVs Inner Coat, Pointing the Way to New Therapies Pitt Team Finds Biologic Mechanism That Causes Noise-Induced Tinnitus and Drug That Can Prevent It Modulating the Immune System to Combat Metastatic Cancer New Mechanism for Estrogen Suppression of Liver Lipid Synthesis Study Suggests New Source of Kidneys for Transplant Engineered Biomaterial Could Improve Success of Medical Implants Infantile Myofibromatosis: First Drug Targets in Childhood Genetic Tumor Disorder Biophysicists Measure Mechanism That Determines Fate of Living Cells Protein Preps Cells to Survive Stress of Cancer Growth and Chemotherapy Drug Reverses Alzheimers Disease Deficits in Mice, Pitt Research Confirms The Secret Lives (and Deaths) of Neurons Baby's Life Saved With Groundbreaking 3-D Printed Device That Restored His Breathing A Nanotechnology Use for Grapefruits in Improving Drug Delivery Scientists Identify 4 Genes in Baboons That Influence Levels of Bad Cholesterol Breakthrough in the Understanding of How Pancreatic Cancer Cells Ingest Nutrients Points to New Drug Target Stem Cell Researchers Move Toward Treatment For Rare Genetic Nerve Disease Stem-Cell-Based Strategy Boosts Immune System in Mice Brain Rewires Itself After Damage or Injury, Life Scientists Discover Research Breakthrough: Human Skin Cells Become Embryonic Stem Cells Pitt Transplant Experts Challenge Assumption, Describe Biological Pathway That Leads to Organ Rejection Squishy Hydrogels May Be the Ticket for Studying Biological Effects of Nanoparticles Alzheimer's Markers Predict Start of Mental Decline Agent Orange Exposure Linked to Life-Threatening Prostate Cancer Rejuvenating Hormone Found to Reverse Symptoms of Heart Failure Progenitor Cells Remain Highly Dynamic in the Adult Brain Duke Engineers Build Living Patch for Damaged Hearts Etubics Platform Generates Solid Immune Response in Colorectal Cancer Patients One-Two Punch Could Be Key in Treating Blindness DNA-Guided Assembly Yields Novel Ribbon-Like Nanostructures Skin Cancer May Be Linked to Lower Risk of Alzheimer's Disease 'Off-The-Shelf' Virus-Specific T-Cells Fight Viral Infections in Stem Cell Transplant Patients UCLA Stem Cell Researchers Move Toward Treatments For Rare Genetic Nerve Disease Study Finds That Bacteria Organize According to 'Rich-Get-Richer' Principle Study: Bladder Cancer Could Reoccur Despite Bladder Removal Researchers Discover Possible Trigger for Spread of Head and Neck Cancer Cells New Cancer Driver Found Epilepsy Cured in Mice Using Brain Cells NYSCF Scientists Create Personalized Bone Substitutes From Skin Cells Boosting 'Cellular Garbage Disposal' Can Delay the Aging Process, UCLA Biologists Report Divide and Define: Clues to Understanding How Stem Cells Produce Different Kinds of Cells NIH Study Provides Clarity on Supplements for Protection Against Blinding Eye Disease Identification of Stem Cells Two Separate Roles Raises Possibility of Therapies That Could Inhibit Fat Formation, Promote Muscle Repair Patterned Hearts New Study Validates Longevity Pathway Discovery Shows Fat Triggers Rheumatoid Arthritis: Paves Way for New Gene Therapies Printable Functional 'Bionic' Ear Melds Electronics and Biology Adult Cells Transformed Into Early-Stage Nerve Cells, Bypassing the Pluripotent Stem Cell Stage Scientists Decode "Molecular Chatter" That Makes Cancer Cells Spread Severe Sports-Related Concussions in Children Prolong Recovery Time Network of Genes Is a Crucial Mechanism Driving Late Onset Alzheimer's Disease Genes Play Role in Wound Healing, Regulate Biological Processes in Human Skin Mild Blast Injury Causes Molecular Changes in Brain Akin to Alzheimers Disease, Pitt-Led Team Says UF Researchers Develop Nanotrain For Targeted Cancer Drug Transport Battery of Tests on Cancer Cells Shows Them as 'Squishy,' Yet Tactically Strong Pitt Team Finds Melatonin Delays ALS Symptom Onset and Death in Mice Stem Cell Transplant Restores Memory, Learning in Mice A Noninvasive Avenue for Parkinson's Disease Gene Therapy FAP Cells Help in Repairing Injured Muscles Recipe for Making Large Numbers of Stem Cells Requires Only One Ingredient, Says NIH/Pitt Team Outcomes for Treating Heart Failure with Cell Therapy, High-Dose Ultrasound Researchers Morph Ordinary Skin Cells Into Functional Brain Cells Researchers Turn Skin Cells Directly Into the Cells That Insulate Neurons Mass. General Team Develops Implantable, Bioengineered Rat Kidney Lower PSA Predicts Better Survival in Sipuleucel T Recipients Progress Reported in Organ Preservation Adding Breast Milk Ingredient to Formula Could Prevent Deadly Intestinal Problem in Premature Babies Study Finds Late-Life Depression Associated with Increased Risk for Dementia Rigid Growth Matrix: A Key to Success of Cardiac Tissue Engineering Ordinary Skin Cells Morphed Into Functional Brain Cells: New Technique Holds Promise For Multiple Sclerosis Mayo Clinic: Cardiopoietic 'Smart' Stem Cells Show Promise in Heart Failure Patients Stem Cells Boom in Vet Clinics Researchers Engineer 'Protein Switch' to Dissect Role of Cancer's Key Players Moving Cells with Light Holds Medical Promise For the First Time, Researchers Isolate Adult Stem Cells from Human Intestinal Tissue Cholesterol Buildup Links Atherosclerosis and Macular Degeneration Biological Transistor Enables Computing Within Living Cells What Advances are Driving Clinical Applications of Tissue Engineering and Regenerative Medicine? Researchers Decode Biology of Blood and Iron Disorders Mapping Out Novel Future Therapies DOD Highlights Breast Cancer Research of McGowan Institute for Regenerative Medicine Faculty Member Clinical Research Forum Awards Brain Computer Interface Technology Healing by the Clock: In Fruit Flies, Intestinal Stem-Cell Regeneration Fluctuates With the Time of Day New Research Reveals How Autophagy Keeps Neural Stem Cells to Replace Damaged Brain, Nerve Cells Research Shows New Separation Process Could Help Advance Stem Cell Therapies Building Better Blood Vessels Could Advance Tissue Engineering Phase 1 ALS Trial is First to Test Antisense Treatment of Neurodegenerative Disease Protein Is Vital to Successful 'Homing' of Stem Cells, Researchers Discover Pitt Team Finds Protein That Ramps Up Inflammation, and Agents That Can Block It Researchers Are First to Use Common Virus to Fortify Adult Stem Cells NYSCF Scientists Develop New Protocol to Ready Clinical Applications of Induced Pluripotent Stem Cells Penn Researchers Show Stem Cell Fate Depends on Grip Opposites Attract: How Cells and Cell Fragments Move in Electric Fields Clinical Trials in a Dish May be More Reliable Than Standard Way of Measuring Drug Effects on Heart, Researchers Say Stem Cells Entering the Heart Can be Tracked With Nano-Hitchhikers, Scientists Say Designing Interlocking Building Blocks to Create Complex Tissues Stem Cell Proliferation and Differentiation Observed Within Hydrogel Childrens Hospital of Pittsburgh of UPMC Study Reveals Success Rate of Minimally Invasive Surgical Approaches in Infants Engineered T Cells Kill Tumors but Spare Normal Tissue in an Animal Model Will Cell Therapy Become a 'Third Pillar' of Medicine? New Insights Into How Genes Turn On and Off Gene Therapy May Aid Failing Hearts Pitt, Mount Sinai Team Finds Novel Mechanism Regulating Replication of Insulin-Producing Beta Cells for Diabetes Treatment Monoclonal Antibody Targets, Kills Leukemia Cells New Method Developed to Expand Blood Stem Cells for Bone Marrow Transplant Cell-Based Immune Therapy Shows Promise in Leukemia Patients Counting White Blood Cells at Home Stem Cells Use Signal Orientation to Guide Division, Study Shows Immune-Cell Therapy Could Strengthen Promising Melanoma Treatment Misregulated Genes May Have Big Autism Role Stem Cell Research Could Expand Clinical Use of Regenerative Human Cells Map of 'Shortcuts' Between All Human Genes Fluorescent Neural Cells from Monkey Skin Mature Into Several Types of Brain Cells in Monkeys Immune Cells Cluster and Communicate 'Like Bees,' Researcher Says New Monoclonal Antibody Developed That Can Target Proteins Inside Cancer Cells Protein Abundant in Cancerous Cells Causes DNA 'Supercoiling' Nanoparticles Loaded With Bee Venom Kill HIV Temp-Controlled 'Nanopores' May Allow Detailed Blood Analysis NIH R21 Grant to Develop Adipose Stem-Cell Based Vascular Grafts Received Vision Restoration: Regenerative Medicine in Ophthalmology Edible Electronics Developed for Medical Device Industry Cell Therapy Combo Aids Stroke Backwards Signals Appear to Sensitize Brain Cells, Rat Study Shows Kryptonite for Cancer Cells Depression Stems from Miscommunication Between Brain Cells; Study Challenges Role of Serotonin in Depression Knowing How Brown Fat Cells Develop May Help Fight Obesity Cord Blood Effective Alternative to Matched Donor Stem Cells For Kids With Rare Disorder Stem Cells From Fat Show Promise in Treatment of Brain Cancer New Hope for Reversing the Effects of Spinal Cord Injury BRAF Inhibitor Treatment Causes Melanoma Cells to Shift How They Produce Energy Signaling Molecule May Help Stem Cells Focus on Making Bone Despite Age, Disease Scientists Identify 'Clean-Up' Snafu That Kills Brain Cells in Parkinson's Disease Obesity, Aging Genes May Play Role in Arthritis Genes Identify Breast Cancer Risk and May Aid Prevention Cell on a Chip Reveals Protein Behavior The 3-D Printing of Tomorrow Researchers on Path to Restoring Vision Loss From Diabetic Eye Disease Regulating Cells: Mechanical Forces Play a Major Role in Assembly and Disassembly of a Protein Essential to Many Cell Functions Long-Suspected Cause of Blindness from Eye Disease Disproved Support Cells Found in Human Brain Make Mice Smarter One Region, Two Functions: Brain Cells Multitasking May Be a Key to Understanding Overall Brain Function Circuitry of Cells Involved in Immunity, Autoimmune Diseases Exposed Researchers Utilize Genetically Corrected Stem Cells to Spark Muscle Regeneration Obesity Makes Fat Cells Act Like They're Infected Researchers Identify Seven New Genes Associated with Macular Degeneration Wearable Artificial Lung to Be Developed at Pitt Through $3.4 Million Grant First Breathing Lung Transplant on East Coast Using OCS Lung Performed Latest Fox Center Research Efforts Childrens Hospital of Pittsburgh of UPMC Study Shows Increase in Liver Transplantation for Hepatoblastoma 2 New Genes Linked to Amyotrophic Lateral Sclerosis and Related Disorders Seven Genetic Risk Factors Found to be Associated with Age-Related Macular Degeneration Reprogramming Adult Cells to Stem Cells Works Better With One Gene Turned Off How Do Bacteria Clog Medical Devices? Very Quickly Study Shows Triple-Negative Breast Cancer Cells Missing Key Enzyme Research Supports Promise of Cell Therapy for Bowel Disease Infusion of Stem Cells and Specially Generated T-Cells from Same Donor Improves Leukemia Survival Swine Cells Could Power Artificial Liver HIF-1α Protein Can Work Directly to Stop New Cells from Forming Bioengineers Print Ears That Look and Act Like the Real Thing Now Hear This: Forerunners of Inner-Ear Cells That Enable Hearing Identified Scientists Find Genes Linked to Human Neurological Disorders in Sea Lamprey Genome OHSU Scientists First to Grow Liver Stem Cells in Culture, Demonstrate Therapeutic Benefit Scientists Find Surprising New Influence on Cancer Genes Distinct Niches in Bone Marrow Nurture Blood Stem Cells Reprogramming Cells to Fight Diabetes UCLA Researchers Further Refine 'NanoVelcro' Device to Grab Single Cancer Cells from Blood Gene Therapy May Activate Stem Cells in Heart Failure Patients New Injectable Hydrogel Encourages Regeneration and Improves Functionality After a Heart Attack Nanotech'ed RNA Drug Reduces Ovarian Cancer Tumors by 83 Percent Bone Marrow Cells Used in Bladder Regeneration Variations in Four Genes Associated With Increased Risk of Colorectal Cancer Fragile X Makes Brain Cells Talk Too Much UCLA Scientists Develop New Therapeutics That Could Accelerate Wound Healing Discovery in HIV May Solve Efficiency Problems for Gene Therapy Protein Central to Cancer Stem Cell Formation Provides New Potential Target Long Noncoding RNAs Control Development of Fat Cells Stem Cell Survival Strategy is Key to Blood and Immune System Health Synthetic Circuit Allows Dialing Gene Expression Up or Down in Human Cells MIT Engineers Create Genetic Circuits in Bacterial Cells Findings Support Link Between Hscrp, Macular Degeneration New Insight Into How Genes Function 'Zombie' Cells May Outperform Live Ones as Catalysts and Conductors Compound Developed by Scientists Protects Heart Cells During and After Attack Investigators Discover Two New Genes Associated With Severe Early-Onset Disorders of Heart Rhythm New Statistical Tool May Help Detect Novel Genes Linked to Heart Disease, Penn Study Reports Tiny Capsule Effectively Kills Cancer Cells Evaluating Evolutionary Rates Could Provide Insight into Functions of Uncharacterized Genes Changes to DNA On-Off Switches Affect Cells' Ability to Repair Breaks, Respond to Chemotherapy Understanding 'Master Regulator' Genes Could Lead to Better Cancer Treatments Immune System Can Use Melanoma's Own Proteins to Kill Off Cancer Cells Growth Factor Aids Stem Cell Regeneration After Radiation Damage How Cancer Cells Rewire Their Metabolism to Survive UIC to Determine Whether Exercise Can Shorten Recovery Time for Stem Cell Transplant Patients Tuberculosis May Lurk in Bone Marrow Stem Cells of Infected Patients Genes Behind Aggressive Endometrial Cancer In Breast Cancer Metastasis, Researchers Identify Possible Drug Target Patients' Own Skin Cells Are Transformed Into Heart Cells to Create 'Disease in a Dish' Monell Scientists Identify Elusive Taste Stem Cells Scientists Learn More About How Inhibitory Brain Cells Get Excited Aging Cells Lose Their Grip on DNA Rogues Better Way to Culture Central Nervous Cells Study Shows Potential of Differentiated iPS Cells in Cell Therapy Without Immune Rejection Study Eyes Stem Cell Blood Test to Detect Macular Degeneration Progression Tumor Cells Engineer Acidity to Drive Cell Invasion New Method Identifies Genes That Can Predict Prognoses of Cancer Patients Cardiac Development Needs More Than Protein-Coding Genes Stem Cell Therapy to Repair Damaged Knee Cartilage Stem Cell Research Helps to Identify Origins of Schizophrenia How Cells' DNA Repair Machinery Can Destroy Viruses Light Shed on Complexity of Gene Therapy for Congenital Blindness Immune Cells Engineered in Lab to Resist HIV Infection, Stanford Study Shows Enzyme Helps Cancer Cells Avoid Genetic Instability Epigenetics Explains Rheumatism? Genes and Their Regulatory 'Tags' Conspire to Promote Rheumatoid Arthritis Stage IV Cancer Cells Even More Susceptible to Grape Seed Extract than Stage II Low Blood Flow to the Premature Brain Disrupts Cells' Ability to Fully Mature Human Hearts Generate New Cells After Birth; Findings Could Lead to Novel Approaches For Treating Heart Failure in Children How Cells Know When It's Time to Eat Themselves Drug Targets Hard-to-Reach Leukemia Stem Cells Responsible For Relapses A Quantum Leap in Gene Therapy of Duchenne Muscular Dystrophy Discovery That Some Seizures Arise in Glial Cells Could Offer New Targets For Epilepsy Treatment Stem-Cell Approach Shows Promise For Duchenne Muscular Dystrophy Rice-Cell Cocktail Kills Cancer Cells, Leaves Normal Cells Alone Next Steps in Potential Stem Cell Therapy For Diabetes: Study Looks at Differentiation of hESCs in Endocrine Cell Progression Multiple Sclerosis Study Reveals How Killer T Cells Learn to Recognize Nerve Fiber Insulators Genetic Form of Anemia Offers New Avenue to Treating Drug-Resistant Tumors Why Do Age-Related Macular Degeneration Patients Have Trouble Recognizing Faces? McGowan Institute for Regenerative Medicine Holds Its Annual Scientific Retreat Regenerative Medicine Clinical Translation McGowan Institute for Regenerative Medicine Affiliated Faculty Member Studies Cerebral Aneurysms Mechanism to Halt Cancer Cell Growth, Discover Potential Cancer Therapy Revealed UCSD Team Invents Brain Cell Breakthrough Sickle Cells Show Potential to Attack Aggressive Cancer Tumors Sensory Hair Cells Regenerated, Hearing Restored in Noise-Damaged Mammal Ear Chemists Devise Inexpensive, Benchtop Method for Marking and Selecting Cells Genes and Obesity: Fast Food Isn't Only Culprit in Expanding Waistlines -- DNA Is Also to Blame Pitt Vaccine Triggers Immunity to Prevent Colon Cancer Cheap and Easy Technique to Snip DNA Could Revolutionize Gene Therapy Pitt Enzyme Discovery May Lead to Better Tests for Tuberculosis Gene Therapy Reprograms Scar Tissue in Damaged Hearts into Healthy Heart Muscle Sorting Stem Cells Childrens Hospital/Pitt-Led Team Finds Molecule That Polices TB Lung Infection, Could Lead to Effective Vaccine Itchiness Explained: Specific Set of Nerve Cells Signal Itch But Not Pain, Researchers Find Scientists Unlock How Insulin Interacts With Cells Rare Form of Active 'Jumping Genes' Found in Mammals Risk Genes for Alzheimer's and Mental Illness Linked to Brain Changes at Birth First Ever 'Atlas' of T Cells in Human Body 2 Novel Treatments for Retinitis Pigmentosa Move Closer to Clinical Trials Low Vitamin D Levels Early in Pregnancy Associated With Lower Birth Weights, Pitt Research Finds Transplanted Neural Stem Cells Treat Amyotrophic Lateral Sclerosis in Mouse Model 'Two-Faced' Cells Discovered in Colon Cancer Brain Cells Activated, Reactivated in Learning and Memory Strange Behavior: New Study Exposes Living Cells to Synthetic Protein Study Hints That Stem Cells Prepare For Maturity Much Earlier Than Anticipated Removing Protein 'Garbage' in Nerve Cells May Help Control 2 Neurodegenerative Diseases Rebuilding Blood Vessels Through Gene Therapy Steering Stem Cells to Become Two Different Building Blocks for New Blood Vessels Protein Regulates Protein Folding in Cells During Stress How Airway Cells Regenerate After Chlorine Gas Injury Gene Therapy Cocktail Shows Promise in Long-Term Clinical Trial for Rare Fatal Brain Disorder Cancer Cells Co-Opt Immune Response to Escape Destruction Protein Creates Paths for Growing Nerve Cells How Hepatitis C Virus Reprograms Human Liver Cells Spread of Cancer Cells May Be Slowed by Targeting of Protein New Technique Could Make Cell-Based Immune Therapies for Cancer Safer and More Effective Ordinary Heart Cells Become 'Biological Pacemakers' With Injection of a Single Gene Tissue Engineering -- Growing New Organs and More: Research Could Lead to Better Ways to Heal Injuries and Develop New Drugs Pitt Cancer Institute Finds New Targets for Drugs to Defeat Aggressive Brain Tumor Pre-Transplant Umbilical Cord Blood Expansion in Lab Speeds Establishment of New Blood Supply in Patients, Reducing High-Risk Time to Recovery Capturing Circulating Cancer Cells Could Provide Insights into How Disease Spreads Joslin Scientists Find That Brown Adipose Tissue Has Beneficial Effects on Metabolism and Glucose Tolerance Fragile X Protein Linked to Nearly 100 Genes Involved in Autism Blocking Myeloid-Derived Suppressor Cells after Lymphopenia Improves Adoptive T-Cell Therapy Steroid Hormone Receptor Prefers Working Alone to Shut Off Immune System Genes Carbon Nanotubes Lower Nerve-Damaging Chloride in Cells Plastics Used in Some Medical Devices Break Down in a Previously Unrecognized Way Studying Marrow, Researchers Accelerate Blood Stem Cells Multitasking Plasmonic Nanobubbles Kill Diseased Cells, Modify Others Mitral Valve Repair Safe and Effective for Elderly Patients Once Considered Too High Risk Based on Age Alone Precisely Engineering 3-D Brain Tissues Arrowhead Publishes First Ever Cholesterol-SiRNA Mediated Gene Knockdown in Primates and Novel DPC Co-Injection Strategy Study Advances Use of Stem Cells in Personalized Medicine Different Kind of Stem Cell Possesses Attributes Favoring Regenerative Medicine Intestinal Immune Cells Play an Unexpected Role in Immune Surveillance of the Bloodstream Regenerative Medicine Technology Meets Funding Milestone Study: Biomarkers May Predict Acute Kidney Injury in Critically Ill Patients First International VAD Guidelines Co-Authored by McGowan Institute for Regenerative Medicine Affiliated Faculty Member Stem Cells Found to Heal Damaged Artery in Pre-Clinical Lab Study Advances in Ophthalmology Oscillating Gel Gives Synthetic Materials the Ability to Speak Advances in Stem Cell Research Techniques and New Transplant Strategies Reveal Opportunities for Improved Patient Outcomes with Reduced Risk of Complications Genes That Predict Whether Trastuzumab Will Work for Breast Cancer Patients Identified Study: Fasting May Benefit Patients With Epilepsy 5 Big Strides to Fight Lung Disease in Our Tiniest Patients Biomedical Technology Research Center Established Watch Out For Sjögren's Syndrome in Dry Eye From Degeneration to Regeneration: Advances in Skeletal Muscle Engineering Transposable Elements Reveal a Stem Cell Specific Class of Long Noncoding RNAs Researchers Link New Molecular Culprit to Breast Cancer Progression McGowan Institute for Regenerative Medicine-Developed Technology: Study Utilizing HeartMate II® Receives FDA Nod Study Identifies Reasons to Opt Out of Bone-Marrow Donor Registries Breakthrough: Restoration of Function Using BCI Technology and Training Programs Stimulating Brain and Nerves at Synchronized Times Improves Hand Motor Function After Incomplete Spinal Cord Injury Pitt Research Sheds New Light on Virus Associated With Developmental Delays and Deafness; Offers Hope for Treatment Cartilage Made Easy With Novel Hybrid Printer Researchers Identify Protein Key in Proliferation of Lymphoma Cells Engineering a Photo-Switch For Nerve Cells in the Eye and Brain New Study Decodes Molecular Mechanisms Underlying Stem Cell Reprogramming How Cells in the Nose Detect Odors Scientists Develop Single-Cell Imaging to Watch the Cell Clock New Type of Bacterial Protection Found Within Cells Wyss Institute Models a Human Disease in an Organ-on-a-Chip Stem Cells + Nanofibers = Promising Nerve Research Discovery of New Type of RNA Could Have Implications for Some Congenital Disorders Highlights from the Second Annual Symposium on Regenerative Rehabilitation MicroRNAs Can Convert Normal Cells into Cancer Promoters 'Different Kind of Stem Cell' Possesses Attributes Favoring Regenerative Medicine Body May Be Able to 'Coach' Transplanted Stem Cells to Differentiate Appropriately Neurons Made from Stem Cells Drive Brain Activity After Transplantation in Laboratory Model Some Cells Dont Know When to Stop Pancreas Stem Cell Discovery May Lead to New Diabetes Treatments Injectable Sponge Delivers Drugs, Cells, and Structure Cells from Skin Create Model of Blinding Eye Disease Fat-Derived Stem Cells Hold Potential for Regenerative Medicine Recently Discovered Stem Cell Population Could One Day Provide Useful Source Material for Kidney Repair Researchers Create New Stem Cell-Derived Cell Type for Treatment of Alzheimer's Team Uses Antisense Technology That Exploits Gene Splicing Mechanism to Kill Cancer Cells Stem Cells Could Heal Equine Tendon Injuries Microscopic Packets of Stem Cell Factors Could be Key to Preventing Lung Disease in Babies Duke Researchers Engineer Cartilage from Pluripotent Stem Cells Researchers Identify Novel Genes That May Drive Rare, Aggressive Form of Uterine Cancer Genetic Tradeoff: Harmful Genes Are Widespread in Yeast but Hold Hidden Benefits Pitt Team Receives $5.4 Million in DOD Grants for High-Definition Scans of Soldiers with Brain Injuries Genetic Link Between Pancreatitis and Alcohol Consumption Modeling Tissue Engineered Constructs Solving Stem Cell Mysteries Omega-3 Intake Heightens Working Memory in Healthy Young Adults Mouse Model Could Help Identify Viral Vectors That May Cause Tumors Researchers at the Doorstep of Stem Cell Therapies for MS, Other Myelin Disorders New Anti-Tumor Cell Therapy Strategies Are More Effective Researchers Test New Gene Therapy Method in Human Cells Breast Cancer Cells Enticed to Spread by 'Tumorous Environment' as Well as Genetic Changes Bacterial Genes Energy-Sensing Switch Discovery Could Have Broad Implications New Study Shows Reprogrammed Amniotic Fluid Cells Could Treat Vascular Diseases Peripheral Blood Stem Cell Transplants from Unrelated Donors Associated with Higher Rates of Chronic Graft-Versus-Host-Disease Researchers Study ACT TIL Approach to Treating Metastatic Melanoma First-of-its-Kind Self-Assembled Nanoparticle for Targeted and Triggered Thermo-Chemotherapy New Technique for Sorting Live Cells May Expedite Biomedical Research Calcium Reveals Connections Between Neurons Leading Bone Marrow Transplant Expert Recommends Significant Change to Current Practice Stem Cell Model for Hereditary Disease Developed UCLA Engineers Control Thousands of Cells Simultaneously Using Magnetic Nanoparticles Rare Cells Regulate Immune Responses; May Offer Novel Treatment for Autoimmune Diseases Human Neural Stem Cells Study Offers New Hope for Children with Fatal Brain Diseases Chaperone Protein Subverts Removal of Glaucoma-Causing Protein First Use in Patient of Conditionally Reprogrammed Cells Delivers Clinical Response A Complex Logic Circuit Made From Bacterial Genes How Cancer Cells Break Free From Tumors Stem Cells Form Human Bone Study Suggests Stem Cell Transplant Survivors at Increased Risk of Developing Heart Disease Mayo Clinic Finds Way to Weed Out Problem Stem Cells, Making Therapy Safer Deadly Complication of Stem Cell Transplants Reduced in Mice Researchers Develop Cranial Neural Crest Cell Lines The Cost of Glaucoma Care: Small Group of Patients Accounts for Large Part of Costs Discovery of Essential Genes for Drug-Resistant Bacteria Reveals New, High-Value Drug Targets Tracking Stem Cell Reprogramming Lab Study Suggests That Male Fertility Can Be Restored After Cancer Treatment Seed Funds Help Make NIH Funding Possible Project Awarded Funding: Targeted Molecular Therapeutics for Head and Neck Cancer Researchers Find Multiple Similarities Between Cancer Cells and Induced Pluripotent Stem Cells Study Examines How to Control Spatial Distribution of Cells in Microenvironments Making it Easier to Make Stem Cells First-Ever Imaging of Cells Growing on Spherical Surfaces Discovery of Reprogramming Signature May Help Overcome Barriers to Stem Cell-Based Regenerative Medicine New Stem Cell Differentiation Study Could Help Scientists Better Understand Genetic Basis of CVD Neural Stem Cells Regenerate Axons in Severe Spinal Cord Injury Study Finds That Natural Killer T-Cells in Fat Tissue Guard Against Obesity Gene Linking Cataracts and Alzheimer's Disease Identified Fasting Makes Brain Tumors More Vulnerable to Radiation Therapy Improved Nanoparticles Deliver Drugs into Brain Researchers Restore Children's Immune Systems with Refinements in Gene Therapy Beacons Light Up Stem Cell Transformation Study Suggests Neonatal Cardiac Stem Cells May Help Mend Children's Broken Hearts Computer Simulations Could Lead to Better Cardiac Pump for Children with Heart Defects Hearing Impaired Ears Hear Differently in Noisy Environments One Step Closer to Understanding Actions of Cells Involved in Atherosclerosis Imaging Metals Within Cells: Identifying The Proteins That Bind Stem Cells Show Promise in Halting Heart Attacks Ripple Effect Genome Wide Scan Maps Mutations in Deadly Lung Cancers Stanford Researchers Create Tiny, Wirelessly Powered Cardiac Device Regenerative Medicine in Vision Research ACL Reconstruction: 4 Points from Dr. Freddie Fu Key Molecules Involved in Forming Long-Term Memories Discovered Marijuana Use May Increase Risk of Testicular Cancer Chemotherapy-Resistant Cancer Stem Cell Could be 'Achilles' Heel' of Cancer New Genetic Mechanism for Controlling Blood Cell Development and Blood Vessel Integrity Found Double Drug Combo Could Shut Down Abnormal Blood Vessel Growth That Feeds Disease Immune Cell Death Safeguards Against Autoimmune Disease Scientists Create Germ Cell-Supporting Embryonic Sertoli-Like Cells from Skin Cells Stem Cell Research: Method to Identify Origins of New Leydig Cells in Males LIN28 Protein Can Bind Directly to Thousands of Messenger RNAs Gene Therapy Restores Sense of Smell to Mice New Approach to Fighting Viral Illnesses Found NPR's Science Friday Addresses Regenerative Medicine Joel S. Schuman, M.D., Part of Team Receiving António Champalimaud Vision Award Grants for Education Projects Related to Wounded Veterans, Persons with Disabilities Received Tumor Suppressor Genes Vital to Regulating Blood Precursor Cells in Fruit Flies Can't Smell Anything? This Discovery May Give You Hope 'Missing Link' Between Blood Stem Cells, Immune System Discovered Researchers Find a Protein That Helps DNA Repair in Aging Cells Moving Toward Regeneration: Scientists Show How Pluripotent Stem Cells Mobilize in Wounded Planarian Worms Researchers Engineer Light-Activated Skeletal Muscle Protein Impedes Microcirculation of Malaria-Infected Red Blood Cells Control of SiRNA Could Aid Regenerative Medicine, Cancer Therapy Researchers Prove That Leukemias Arise From Changes That Accumulate in Blood Stem Cells Merging the Biological, Electronic Repairing Cartilage with Fat: Problems and Potential Solutions Study Identifies Human Melanoma Stem Cells Research in the News: Gene Therapy Shows Promise in Neuron Repair and Pain Relief Histone-Modifying Proteins, Not Histones, Remain Associated With DNA Through Replication Video Shows the Traffic Inside a Brain Cell: New Imaging Technique Reveals the Brain's Continuous Renovation Scientists Manipulate the Set2 Pathway to Show How Genes Are Faithfully Copied Researchers Return Blood Cells to Stem Cell State Low Oxygen Boosts Stem Cell Survival in Muscular Dystrophy Therapy Sensor Detects Glucose in Saliva and Tears for Diabetes Testing New Nanoparticles Shrink Tumors in Mice Contact Lens Sensor Measures 24-Hour Intraocular Pressure Regenerative Medicine for Osteoarthritis Regenerative Medicine Work to Develop Devices for Improving Lives of Amputees Cell Therapy Through the Lymph Node Stem Cells Can Become Anything -- But Not Without This Protein Stem Cells May Prevent Post-Injury Arthritis Immune System Uses Heart Channel to Select Powerful Defenders Study: Vaccine Targets Malignant Brain Cancer Antigens, Significantly Lengthens Survival Researchers Say Decoy Shows Promise as Cancer-Fighter in Novel Phase 0 Trial White Blood Cells Mediate Insulin Resistance Team's Study Could Pave Way to Rejection-Free Adult Stem Cells New Research Could Increase Blood Supplies For Transfusions Sperm Precursor Cells Made in the Lab Could One Day Restore Male Fertility Targeted Oxidation-Blocker Prevents Secondary Damage after Traumatic Brain Injury Blocking Destruction of Defective Proteins Unexpectedly Delays Neurodegeneration in Mice, Study Shows New Class of Proteins Allows Breast Cancer Cells to Evade Tyrosine Kinase Inhibitors Advances in Cartilage Tissue Engineering--Dr. Rocky Tuan's Lab Contributes to Progress Life Expectancy Increasing For Type 1 Diabetics, According to Latest Pitt Research Neuroscientists Find Brain Stem Cells That May Be Responsible For Higher Functions, Bigger Brains Fruit Fly Research Might Change Diabetes Treatment Composite Nanofibers Developed by Penn Scientists Next Chapter in Orthopaedic Biomaterials New Drug Successfully Halts Fibrosis in Animal Model of Liver Disease Aurka-to-P53 Signaling: A Link Between Stem Cell Regulation and Cancer Study Shows Higher Healing Rate Using Unique Cell-Based Therapy in Chronic Venous Leg Ulcers Embryonic Blood Vessels That Produce Blood Stem Cells Can Also Make Heart Muscle Cells Novel Therapy May Prevent Damage to the Retina in Diabetic Eye Diseases Research May Lead to New Treatment For Type of Brain Cancer New Biomimetic Controlled-Release Capsules May Help in Gum Disease Excellence, Strong Research Help UPMC Reach 3,000 Heart, Lung Transplants Muscle Cell Grafts Keep Broken Hearts From Breaking Rhythm Unexpected Variation in Immune Genes Poses Difficulties for Transplantation Researchers Pinpoint Peptide That Blocks Hepatitis C Virus Entry Regenerative Medicine Approach to Reconstitute Functional Musculotendinous Tissue Regenerative Medicine and Rehabilitation Meeting in Pittsburgh ECM: A Regenerative Medicine Tool New Study Finds Link Between Cell Division, Growth Rate Brain's Stem Cells 'Eavesdrop' to Find Out When to Act Infection Warning System in Cells Contains Targets For Antiviral and Vaccine Strategies Stem Cell Therapy Could Offer New Hope For Defects and Injuries to Head, Mouth Stem Cells Repair Hearts Early in Life, But Not in Adults Liver Cancer Cells Stop Making Glucose as They Become Cancerous Cell Receptor Has Proclivity for T Helper 9 Cells, Airway Inflammation Tumor Cells Inner Workings Predict Cancer Progression Driver of Breast Cancer Stem Cell Metastasis Found Gene Therapy Holds Promise For Reversing Congenital Hearing Loss Behold, The Artificial Jellyfish: Researchers Create Moving Model, Using Silicone Polymer and Heart Muscle Cells Neurons Derived From Cord Blood Cells May Represent New Therapeutic Option Pittsburgh to Host Upcoming TMJ Bioengineering Conference Abnormal Chromosome Count May Protect Liver Cells from Injury Science of the Olympics, Paralympics The Yin and Yang of Stem Cell Quiescence and Proliferation Inflammatory Pathway Spurs Cancer Stem Cells to Resist HER2-Targeted Breast Cancer Treatment High Definition Fiber Tracking Images Accurately Reflect Brain Fiber Anatomy Beneficial Bacteria May Help Ward Off Infection Team Finds New Type of Severe Asthma, Can Be Treated with Drugs that Suppress the Immune System Researchers Turn Skin Cells Into Brain Cells, a Promising Path to Better Parkinson's Treatment Deadly Liver Cancer May Be Triggered by Cells Changing Identity Helper T Cells, Not Killer T Cells, Might be Responsible for Clearing Hepatitis A Infection Gene Therapy Treatment Extends Lives of Mice with Fatal Disease With Drug-Loaded Nanogel, Yale Researchers Attack Cancerous Tumors Second Generation MC3 Lipid Nanoparticles Discovered Staying on Target: New Strategy Advances Stem Cell Culture Techniques New Type of Stem Cell Preparation Could Bring Pain Relief to Diabetics What Happens When We Sunburn: Red Is RNA Damage to Skin Cells Researchers Discover a Cell-Signaling Molecule in Immune System That Could Help Treat Dangerous Skin Cancer $4.5 Million Grant Obtained to Study Potential Improvements for Wheelchair Users Study Shows Newly Isolated 'Beige Fat' Cells Could Help Fight Obesity Oligodendroglia Cells Protect Neurons Against Neurodegeneration Discovery of Epigenetic Links in Cell-Fate Decisions of Adult Stem Cells Paves Way for New Osteoporosis Treatments Gladstone Scientists Identify Critical Process in Stem Cell Development World's Fastest Camera Used to Detect Rogue Cancer Cells Antibodies Reverse Type 1 Diabetes in New Immunotherapy Study Patient-Derived Stem Cells Could Improve Drug Research for Parkinson's Genetic 911: Cells Emergency Systems Revealed Adult Stem Cells From Bone Marrow: Cell Replacement/Tissue Repair Potential in Adult Bone Marrow Stem Cells in Animal Model Breaking the Skin Barrier: Drugs Topically Deliver Gene Therapy via Commercial Moisturizers for Skin Disease Treatment New Way to Grow, Isolate Cancer Cells May Add Weapon Against Disease Scientists Improve Living Tissues with 3D-Printed Vascular Networks Made From Sugar Scientists Develop Alternative to Gene Therapy New Properties of Stem Cells via Simulated Microgravity New Genes Contributing to Autism and Related Neurodevelopmental Disorders Uncovered Regenerative Medicine: Nerve Regeneration Technology Regenerative Medicine Projects: 3-D Tissue Chips Clinical Trial: Neuroprotective Agent for Treating Severe Traumatic Brain Injury Smart Materials Get SMARTer Endoscopic Therapy is an Effective Treatment for Chronic Pancreatitis Bioengineers Discover Single Cancer Cell Can Produce Up to Five Daughter Cells Epigenetics Alters Genes in Rheumatoid Arthritis Advancing the Next Generation of Plastic Surgeons Successful Transplant of Patient-Derived Stem Cells into Mice with Muscular Dystrophy Human Model of Huntington's Disease Created From Skin's Stem Cells Less Invasive Spinal Surgery Helps Patients Recover Quicker Huntingtons Research Tool Developed Buck Scientists Correct Huntington's Disease Mutation in Induced Pluripotent Stem Cells $8.3 Million NIH Grant to Study Sarcoidosis, Alpha-1 Antitrypsin Deficiency Awarded Glucose Deprivation Activates Feedback Loop That Kills Cancer Cells, Study Shows Gene Mutations Cause Massive Brain Asymmetry Blood-Brain Barrier Building Blocks Forged From Human Stem Cells Lab-Engineered Kidney Project Reaches Early Milestone Carcinogens Linked to Cancer Stem Cells, But Spinach Can Help 'Master Molecule' May Improve Stem Cell Treatment of Heart Attacks Understanding of Spinal Muscular Atrophy Improved With Use of Stem Cells New Method Generates Cardiac Muscle Patches From Stem Cells Regenerative Medicine Spin Off Technology Moves Closer To Clinical Use Control Gene For 'Conveyor Belt' Cells Could Help Improve Oral Vaccines, Treat Intestinal Disease How Aging Normal Cells Fuel Tumor Growth and Metastasis "Magical State" of Embryonic Stem Cells May Help Overcome Hurdles to Therapeutics Synthetic Cells Used to Bioengineer New Forms of Silica Gladstone Scientists Reprogram Skin Cells Into Brain Cells Mapping Genes: New Risk Factors for Neurodegenerative Diseases Found Study Using Stem Cell Therapy Shows Promise in Fight Against HIV New Microdevice Enables Culture of Circulating Tumor Cells for Cancer Diagnosis, Treatment 'Housekeeping' Mechanism for Brain Stem Cells Discovered Gladstone Scientists Regenerate Damaged Hearts by Transforming Scar Tissue into Beating Heart Muscle Packaging Therapeutic RNAs For Targeted Treatment of Breast Cancer Amniotic Fluid Could Be Elixir that Prevents Deadly Gut Inflammation in Preemies Center for Military Medicine Research Established at University of Pittsburgh Blocking Key Protein Slows Aging Immune Cells in the Gut May Improve Control of HIV Growth A Better Way to Grow Bone: Fresh, Purified Fat Stem Cells Grow Bone Faster and Better The Real Culprit Behind Hardened Arteries? Stem Cells, Says Landmark Study How Cells Communicate to Activate Notch Signaling Mechanism That Maintains Stem Cells Readiness Identified Scientists Measure Communication Between Stem Cell-Derived Motor Neurons and Muscle Cells Double Duty: Versatile Immune Cells Play Dual Roles in Human Skin Dynamic Changes in Gene Regulation in Human Stem Cells Revealed Stem Cells Poised to Self-Destruct for the Good of the Embryo Sloppy Shipping of Human Retina Leads IU Researchers to Discover New Treatment Path for Eye Disease Scar Tissue Turned Into Heart Muscle Without Using Stem Cells Study Links Genes to Common Forms of Glaucoma Cells in Blood Vessel Found to Cling More Tightly in Regions of Rapid Flow Just a Few Cell Clones Can Make Heart Muscle Molecular Probes Identify Changes in Fibronectin that May Lead to Disease Projects of Six McGowan Institute for Regenerative Medicine Affiliated Faculty Members Receive Coulter Translational Program Funds Research Finds Predictive Value of Circulating Tumor Cells in Early Stage Breast Cancer Immune System: How Memory B Cells Stay 'in Class' to Fight Different Infections Not All Tumor Cells Are Equal: Huge Genetic Diversity Found in Cells Shed by Tumors Clusters of Cooperating Tumor-Suppressor Genes Are Found in Large Regions Deleted in Common Cancers New Muscular Dystrophy Treatment Approach Developed Using Human Stem Cells Scientists Identify Prostate Cancer Stem Cells Among Low-PSA Cells Beehive Extract Shows Potential as Prostate Cancer Treatment Aged Hematopoietic Stem Cells Rejuvenated To Be Functionally Younger Improved Adult-Derived Human Stem Cells Have Fewer Genetic Changes Than Expected Light-Induced Delivery of Nitric Oxide Eradicates Drug-Resistant Bacteria Discovery Expected to Shift Research Direction in Lupus and Asthma Amino Acid Consumption Associated With How Fast Cancer Cells Divide Gene Therapy Can Correct Forms of Severe Combined Immunodeficiency Stem-Cell-Growing Surface Enables Bone Repair Scientists Discover Marker to Identify, Attack Breast Cancer Stem Cells Scientists Discover Clues to Muscle Stem Cell Functions Successful Stem Cell Differentiation Requires DNA Compaction, Study Finds A Single Stem Cell Mutation Triggers Fibroid Tumors: Mutated Stem Cell 'Goes Wild' in Frenzied Tumor Expansion Genetically Modified T Cell Therapy Shown to be Safe, Lasting in Penn Medicine Study of HIV Patients How Stem Cell Therapy Can Keep the Immune System Under Control Growing Up as a Neural Stem Cell: The Importance of Clinging Together and Then Letting Go Culprit Responsible For Severe Systemic Scleroderma Complications in African-Americans Found Agent That Can Block Fibrosis of Skin, Lungs Identified Type of Viral Infection of Eye Associated With Disease Causing Blindness in the Elderly New Stem Cell Technique Promises Abundance of Key Heart Cells Neuron-Nourishing Cells Appear to Retaliate in Alzheimer's Mechanical Properties of Stem Cells Can Foretell What They Will Become Growth Factor in Stem Cells May Spur Recovery from Multiple Sclerosis A Cell's First Steps: Building a Model to Explain How Cells Grow Human Genes Transplanted Into Zebrafish: Helps Identify Genes Related to Autism, Schizophrenia, and Obesity Delivery System for Gene Therapy May Help Treat Arthritis Drug Kills Cancer Cells by Restoring Faulty Tumor Suppressor Bone Grown From Human Embryonic Stem Cells Novel Approach to Stimulate Immune Cells Gene Therapy for Hearing Loss: Potential and Limitations Activating Genes That Suppress Tumors and Inhibit Cancer Multipotent Stromal Stem Cells from Normally Discarded Human Placental Tissue Demonstrate High Therapeutic Potential Children with Rare, Incurable Brain Disease Improve After Gene Therapy New Genes Contributing to Autism Discovered: Genetic Links Between Neurodevelopment and Psychiatric Disorders Scientists Show Lab-Made Heart Cells Ideal for Disease Research, Drug Testing Cells in Normal Tissue Seem to Have 'Personal Space' Issues: Factor in Maintaining Healthy Tissue New Genes Linked to Brain Size, Intelligence Engineered Stem Cells Seek Out and Kill HIV in Living Mice How Cells Distinguish Between Disease-Causing and Innocuous Invaders Major Source of Cells' Defense Against Oxidative Stress Identified Arsenic Turns Stem Cells Cancerous, Spurring Tumor Growth Mutations in Three Genes Linked to Autism Spectrum Disorders NIH Study Finds Method to Improve Transplant Cell Delivery Study: Intensivist Presence at Night Improves Patient Outcomes in ICUs with Limited Daytime Intensivist Staffing To Prevent Leukemia's Dreaded Return, Go For the Stem Cells Study Shows How Embryonic Stem Cells Orchestrate Human Development Scientists Identify Novel Pathway for T-Cell Activation in Leprosy Gene Therapy for Epilepsy Could Stop Seizures, UF Researchers Say Bio-hybrid Device Acts as Thermostat to Control Systemic Inflammation in Sepsis Screening for Esophageal Disease with Unsedated Transnasal Endoscopy is Safe and Feasible Cells on the Move: Why Some Cells Stay on Track and Others Don't Nanotechnology Used to Hunt For Hidden Pathogens Genes Identified in Common Childhood Obesity Tiny Hitchhikers Attack Cancer Cells: Gold Nanostars First to Deliver Drug Directly to Cancer Cell Nucleus Researchers Derive Purified Lung and Thyroid Progenitors from Embryonic Stem Cells Live Cells 'Printed' Using Standard Inkjet Printer Cancer Cells Send Out the Alarm on Tumor-Killing Virus New Stem Cell Line Provides Safe, Prolific Source for Disease Modeling and Transplant Studies Kidney Attack As Serious as Heart Attack, Warns UPMC Critical Care Expert Genome Variation in Prostate Tumors and Blood Samples Could Help Predict Disease Progression, Says Pitt Team Study Assesses the Utility of the Destination Therapy Risk Score in Patients with Continuous Flow LVADs Patients Are Their Primary Focus Renal Cell Carcinoma Focus of Clinical Trial Scientists Produce Eye Structures From Human Blood-Derived Stem Cells Cancer Epigenetics: Breakthrough in ID'ing Target Genes Scientists Identify More Than 500 Genes That May Cause Pancreatic Cancer Sending Out an SOS: How Telomeres Incriminate Cells That Can't Divide A Trip to the Gym Alters DNA How Red Blood Cells Get So Big -- And the Bad Things That Happen When They Don't Protein Complex Affects Cells' Ability to Move, Respond to External Cues Planarian Genes That Control Stem Cell Biology Identified Caltech Researchers Develop Gene Therapy to Boost Brain Repair for Demyelinating Diseases Repeated Injections of Human Umbilical Cord Blood Cells Improved Motor Neuron Survival, Delayed Disease Progression, and Increased Lifespan Regenerative Medicine Spin-Out Funds Research Fellowship Bone Marrow Stem Cells Improve Heart Function, Study Finds DRI Study Shows Stem Cells Can Replace Anti-Rejection Drug for Transplants Stem Cells Hint at Potential Treatment for Huntington's Disease Scientists Produce Eye Structures From Human Blood-Derived Stem Cells Mechanism in Cells That Leads to Inflammatory Diseases Discovered UCLA Scientists Find Way to Repair Mutations in Human Mitochondria Egg-Making Stem Cells Found in Adult Ovaries Injectable Gel Could Repair Tissue Damaged by Heart Attack Gene Therapy for Inherited Blindness Succeeds in Patients Other Eye Parkinson's Disease: Study of Live Human Neurons Reveals the Disease's Genetic Origins, New Drug Targets Islet Function Improved With Enhanced Oxygen and GHRH Agonist in Bioartificial Pancreas Neuralstem ALS Stem Cell Trial Interim Results Reported in the Journal, STEM CELLS Bone Marrow Transplant Arrests Symptoms in Model of Rett Syndrome Personalized Immune Mouse Offers New Tool for Studying Autoimmune Diseases New Approach to Treating Type I Diabetes? Columbia Scientists Transform Gut Cells Into Insulin Factories Study Shows Advance in Using Patients Own Tumor-Fighting Cells to Knock Back Advanced Melanoma Delivering RNA with Tiny Sponge-Like Spheres Novel Bioactive Peptides Promote Wound Healing in Vivo Penn Study Shows Sustained Safety and Efficacy of Gene Therapy for Inherited Retinal Disease Killing a Cancer Cell from the Inside Out Versatile Synthetic Platform to Produce Biodegradable Biomaterials for Specific Biomedical Applications Developed Genes Linked to Post-Traumatic Stress Disorder Protective Gene in Fat Cells May Lead to Therapeutic for Type 2 Diabetes Once Considered Mainly 'Brain Glue,' Astrocytes' Power Revealed How Genes Organize the Surface of the Brain Combination Treatment in Mice Shows Promise for Fatal Neurological Disorder in Kids Developing Effective Stem Cell Therapies for Heart Disease Will Hinge on Collaboration Between Multiple Specialties Influencing Stem Cell Fate Gene Therapy Kills Breast Cancer Stem Cells, Boosts Chemotherapy Expression of Pluripotency-Associated Gene Marks Many Types of Adult Stem Cells Immune Mechanism Blocks Inflammation Generated by Oxidative Stress Cocaine Users Have 45 Percent Increased Risk of Glaucoma Shaping Up: Controlling a Stem Cell's Form Can Determine Its Fate Gene Therapy Approach to Grow Blood Vessels in Ischemic Limbs Through Regenerative Medicine, Patients in Need May One Day Get Support for a Failing Liver Cancer Stem Cell Vaccine in Development Shows Antitumor Effect Estrogen is Responsible for Slow Wound Healing in Women, Study Finds Genes for Learning, Remembering, and Forgetting Oscillating Gel Acts Like Artificial Skin, Giving Robots Potential Ability to Feel New Gene Therapy Approach Developed for Red Blood Cell Disorders Nano Rescues Skin: Shrimp Shell Nanotech for Wound Healing and Anti-Aging Face Cream Egg-Producing Stem Cells Isolated From Adult Human Ovaries Diagnostic Tool: Polymer Film Loaded With Antibodies Can Capture Tumor Cells Faster Way to Catch Cells: New Microfluidic Device Could be Used to Diagnose and Monitor Cancer and Other Diseases Blocking Telomerase Kills Cancer Cells but Provokes Resistance, Progression Scientists Successfully Expand Bone Marrow-Derived Stem Cells in Culture New Director and Associate Director of McGowan Institute for Regenerative Medicine Named How a Bacterial Pathogen Breaks Down Barriers to Enter and Infect Cells Study Finds New Genes That Cause Baraitser-Winter Syndrome, a Brain Malformation Penn Study Reveals Safety of CT Scans for Rapid Rule Out of Heart Attacks in ER Chest Pain Patients Controlling Protein Function With Nanotechnology How Cancer Cells Change Once They Spread to Distant Organs Scientists Trigger Muscle Stem Cells to Divide Research Reveals How Dynamic Changes in Methylation Can Determine Cell Fate A Heart of Gold: Better Tissue Repair After Heart Attack Mount Sinai Researchers Find Promising New Target in Treating and Preventing the Progression of Heart Failure Scripps Research Team Overcomes Major Obstacle for Stem Cell Therapies and Research Regenerative Medicine Focus of TEDx Presentation in Argentina Anatomy of Success: Genetic Research Develops Tools for Studying Diseases, Improving Regenerative Treatment $2.5 Million Awarded to Develop Better Heart Valve Treatment Cellular Cocktail Aids Organ Transplants UCLA Discovery That Migrating Cells 'Turn Right' Has Implications for Engineering Tissues, Organs Yale Study Proves Nobody Is Genetically Perfect Mutation Implicated in Broken Heart SIV Infection May Increase T Cells Radiation Treatments Generate Cancer Stem Cells from Less Aggressive Breast Cancer Cells Starve a Virus, Feed a Cure? Scientists Identify Neural Activity Sequences That Help Form Memory, Decision-Making Epigenetic Signatures Direct the Repair Potential of Reprogrammed Cells Cancer Epigenetics: Breakthrough in Identifying Target Genes New Research Characterizes Glaucoma as Neurologic Disorder Rather Than Eye Disease A Supercharged Protein Reduces Damage From Heart Attack Cell and Signaling Pathway That Regulates the Placental Blood Stem Cell Niche Identified Delayed Stem Cell Therapy Following Heart Attack Is Safe But Not Effective Pitt: Breakdown of Unsaturated Fat Leads to More Complications of Acute Pancreatitis in Obese Patients Lung Stem Cells Offer Therapeutic Clues Researchers ID Genetic Mutation Associated With High Risk of Age-Related Macular Degeneration NIH-Funded Researchers Correct Sickle Cell Disease in Adult Mice Emerging Pharmaceutical Platform May Pose Risks to Retinal Health Scientists Turn Liver Cells Directly Into Neurons With New Technique Expression of Pluripotency-Associated Gene Marks Many Types of Adult Stem Cells Scripps Research Scientists Find Stem Cell Reprogramming Technique Is Safer Than Previously Thought Changing Criteria for Umbilical Cord Transplantation Could Improve Survival Rates, MCW Researcher Discovers Scientists at New York Stem Cell Foundation, Columbia U. Make Advance in Development of Patient-Specific Stem Cells Rebooting the System: Immune Cells Repair Damaged Lung Tissues After Flu Infection, Penn Study Finds NIH Scientists Find Approach to Enhance and Prolong Immune Attack Against Tumor Cells Biomimetics Is Focus of Senior Vice Chancellors Research Seminar Series Lecture Memory Formation Triggered by Stem Cell Development Scientists Demonstrate Effective New 'Biopsy in a Blood Test' to Detect Cancer Cell Signaling Key to Stopping Growth and Migration of Brain Cancer Cells Mapping the Destructive Path from Cigarette to Emphysema Breast Cancer and Heart Disease May Have Common Roots: Study New Insights Come From Tracing Cells That Scar Lungs UC Davis to Test Stem Cell Therapy to Regenerate Lumbar Discs Hydrogen Peroxide Provides Clues to Immunity, Wound Healing, and Tumor Biology Technologies Give High-Resolution 'Snapshot' of Cancer Tissues Tales From the Crypt: Penn Study on Gut Cell Regeneration Reconciles Long-Standing Research Controversy Penn Study Describes First Proof of Principle for Treating Rare Bone Disease Terminating 'Serial Killers' Makes Cell Therapy Safer Programming Cells to Home to Specific Tissues May Enable More Effective Cell-based Therapies Stomach Cells May Give Rise to Esophageal Cancer UA Researchers Find the Healing Properties of a Spiders Web UCSF Stem Cell Study Suggests Novel Strategy for Heart Attack New Valve Offers Relief for Aortic Stenosis Freeze-Dried Heart Valve Scaffolds Hold Promise for Heart Valve Replacement Research is Foundation Toward Cell Therapy to Help Stress Urinary Incontinence Scientists Discover Molecular Secrets of 2,000-Year-Old Chinese Herbal Remedy Complex Wiring of the Nervous System May Rely on Just a Handful of Genes and Proteins Researchers Develop New Method for Creating Tissue Engineered Scaffolds Nanotube Therapy Takes Aim at Breast Cancer Stem Cells DNA Sequencing Helps Identify Cancer Cells for Immune System Attack Researchers Develop Gene Therapy to Boost Brain Repair for Demyelinating Diseases Scientists Make Strides Toward Fixing Infant Hearts UC Davis Investigators Develop Method of Directing Stem Cells to Increase Bone Formation and Bone Strength Stem Cells Could Drive Hepatitis Research Forward Scientists Turn Skin Cells Into Neural Precursors, Bypassing Stem-Cell Stage Study Finds Leukemia Cells Are 'Bad to the Bone' Researchers Induce Alzheimers Neurons from Pluripotent Stem Cells Grape Seed Extract Kills Head and Neck Cancer Cells, Leaves Healthy Cells Unharmed Vaccines to Boost Immunity Where it Counts, Not Just Near Shot Site Scientists Keep Their Eyes on Peripheral Vision Immune System Memory Cells Have Trick for Self Preservation Focus on Glaucoma Origins Continues Path Toward Potential Cure Study Finds That Tumor Cells Can Prevent Cancer Spread A First: Brain Support Cells from Umbilical Cord Stem Cells Scientists Reveal How Bacteria Build Homes Inside Healthy Cells LVADs as Destination Therapy Rather Than Bridge-to-Transplant The Lancet Features Tissue Engineering Work of Dr. Stephen Badylak Genes Linked to Cancer Could Be Easier to Detect With Liquid Lasers Same Genes Linked to Early- and Late-Onset Alzheimer's Disease Scientists Illuminate Cancer Cells' Survival Strategy Need Muscle For a Tough Spot? Turn to Fat Stem Cells Study Identifies Blood-Forming Stem Cells' Growth UF Researchers Develop Gene Therapy That Could Correct a Common Form of Blindness Vision Improves Modestly in Patients After Human Embryonic Stem Cell Transplants Inflammatory Mediator Promotes Colorectal Cancer by Stifling Protective Genes Smooth Muscle Cells Created From Patients Skin Cells Research Team Discovers Genes and Disease Mechanisms Behind a Common Form of Muscular Dystrophy Cancer Cells Feed on Sugar-Free Diet Stem Cell Therapy Reverses Diabetes NSCI Research Group Identifies a Novel Stem Cell Source in the Adult Human Eye OHSU Research Demonstrates Not All Embryonic Stem Cells Are Equal; Produces the Worlds First Primate Chimeric Offspring UGA Scientists Hijack Bacterial Immune System Cleveland Clinic Researcher Discovers Genetic Cause of Thyroid Cancer Enzyme That Flips Switch on Cells' Sugar Cravings Could be Anti-Cancer Target Aging Stem Cells May Explain Higher Prevalence of Leukemia, Infections Among Elderly Neurons Grown From Skin Cells May Hold Clues to Autism Dendritic Cells Protect Against Acute Pancreatitis Implanted Neurons, Grown in the Lab, Take Charge of Brain Circuitry Babies Placenta Could Help Repair Mothers Injured Heart Novel Surgical Adhesive Begins Clinical Trials in the United States McGowan Institute for Regenerative Medicine Research Featured on Cover of Prestigious Journal Preclinical Testing: Regenerative Medicine Stem Cell Therapy for Disabled Stroke Patients Outside Temperatures, Sun Exposure, and Gender May Trigger Glaucoma Cell Membrane Proteins Could Provide Targets for Broader Vaccines Novel Immuno-Gene Therapy Shows Promise for The Treatment of Rare, Deadly Form of Cancer Intestine Crucial to Function of Immune Cells, Research Shows Researchers Say Therapy Improves Stem Cell Engraftment in Umbilical Cord Blood Transplant Recipients Scar Findings Could Lead to New Therapies, Stanford Researchers Say Suppression of Protein Critical to Cell Division Stops Cancer Cells from Dividing, Kills Them USC Scientists Find Mechanism That Allows For Reprogramming Stem Cells Breaking Oncogene's Hold on Cancer Cell Provides New Treatment Direction Neuroscientists Find Genetic Trigger That Makes Stem Cells Differentiate in Nose Epithelia Salk Researchers Develop Safe Way to Repair Sickle Cell Disease Genes Long Non-Coding RNA Prevents the Death of Maturing Red Blood Cells Regeneration of Specialized Cells Offers Hope for Treating Chronic Kidney Disease Not All Cellular Reprogramming Is Created Equal Human Skin Yields Stem Cell-Like Cells Cancer Cells' DNA Repair Disrupted to Increase Radiation Sensitivity Gene Therapy Can Protect Against HIV Super Athletic Mice Are Fit Because Their Muscles Burn More Sugar New Approach to Graft-Versus-Host Disease Treatment Results in Sustained Improvement for Some Patients Stem Cells Engineered to Kill Cancer Recipient's Immune System Governs Stem Cell Regeneration Nerve Cells Key to Making Sense of Our Senses Fatty Bundles Sneak siRNA Into Cells Scientists Uncover Mechanism That Regulates Human Pluripotent Stem Cell Metabolism UGA Scientists Develop New Method for Producing Tissues from Stem Cells Combination Epigenetic Therapy Clinical Trial Results Grafting of Human Spinal Stem Cells Into ALS Rats Best With Immunosuppressant Combination Pitt-Developed Optimization Method Helps Determine Flu Vaccine Composition/Timing Regulatory Enzyme Overexpression May Protect Against Neurodegeneration in Huntington's Disease Unappreciated Link Between Wound Healing and Diabetes 'PARP' Drug Sabotages DNA Repair in Pre-Leukemic Cells Penn Researchers Repair Immune System in Leukemia Patients Following Chemotherapy Novel Nanoparticle Mimicking Virus Offers New Route to Gene Therapy Study Unlocks Origins of Blood Stem Cells New Half-Match Bone Marrow Transplant Procedure Yields Promising Outcomes for Cancer Patients Yale Scientists Find Stem Cells That Tell Hair It's Time to Grow Insight into the Pathophysiology of ALS Cell-Specific Mechanism-Based Gene Therapy Approach to Treat Retinitis Pigmentosa Virus Kills Breast Cancer Cells in Laboratory Genes Discovered That Repair Neurons Promising Target in Treating and Preventing the Progression of Heart Failure Identified Computer-Aided Design Used For Breast Tissue Reconstruction Fetal Tissue Plays Pivotal Role in Formation of Insulin-Producing Cells Two Genes That Cause Familial ALS Shown to Work Together Starving Inflammatory Immune Cells Slows Damage Caused by Multiple Sclerosis Scientists Unravel the Cause of Rare Genetic Disease: Goldman-Favre Syndrome Explained New Roles Emerge For Non-Coding RNAS in Directing Embryonic Development Georgetown Researchers Identify Unique Gene Mutation Causes Cancer Regenerative Medicines Potential Fountain of Youth Regenerative Medicine Technique Highlighted on The Dr. Oz Show Synthetic Self-Assembling Collagen for Tissue Engineering Bone Marrow Stem Cell Therapy Safe for Acute Stroke Uterine Stem Cells Used to Treat Diabetes in Mice Gene Replacement Treats Copper Deficiency Disorder in Mice From Skin Cells to Motor Neurons Research Aims to Starve Breast Cancer Cells Rare Immune Cell is Asset and Liability in Fighting Infection New Study Shows Zinc Suppresses Pancreatic Cancer Cells Cardiac Researchers Discover Predictor of Stem Cell Efficacy in Treating Heart Failure Scientists Claim Differentiated Cancer Cells Can Convert to Stem-Like Cells to Maintain Equilibrium Scientists Identify Mutations in Two Tumor Suppressor Genes in Oligodendrogliomas New Factor in HIV Infection Uncovered Malignant Stem Cells May Explain Why Some Breast Cancers Develop and Recur New Study Shows Modified Citrus Pectin Activates Powerful Immune Responses Inhibiting Key Enzymes Kills Difficult Tumor Cells in Mice Scientists Copy the Ways Viruses Deliver Genes Researchers Use Human Cells to Engineer Functional Anal Sphincters in Lab Research Team Finds New Genetic Cause of Blinding Eye Disease Researchers Develop Risk Assessment Model for Advanced Age-Related Macular Degeneration Technique to Stimulate Heart Cells May Lead to Light-Controlled Pacemakers UNC-Duke Ties Lead to Collaborative Finding About Cell Division and Metabolism Texas Scottish Rite Hospital for Children (TSRHC) Researchers Discover Genes Associated With Idiopathic Scoliosis Using Regenerative Medicine to Create an Artificial Intestine 3-D Models to Prepare for Complex Face Transplants Created Targeting a Cure: Research Looks at Developing a Bull's-Eye Therapy to Combat Lung Cancer Cells Derived From Pluripotent Stem Cells May Pose Challenges for Clinical Use, Research Molecular Delivery Truck Serves Gene Therapy Cocktail Breakthrough Discovery Is Likely to Advance Medicine and Human Health Discovery May Eliminate Potentially Lethal Side Effect of Stem Cell Therapy Immunogene Therapy Combined with Standard Treatment is Safe for Patients with Brain Tumors Growing a Heart in the Lab Newts and Salamanders Can Regrow Their Damaged Hearts, So Why Can't We? Genetically Modified "Serial Killer" T Cells Obliterate Tumors in Patients with Chronic Lymphocytic Leukemia, Penn Researchers Report Genetically-Engineered Spider Silk for Gene Therapy USC Scientist Develops Virus That Targets HIV Gene-Therapy Enzymes Make Unpredicted Errors Natural Killer Cells Participate in Immune Response Against HIV Its in the Sugar: Mayo Clinic Shows How Metabolism Affects Stem Cell Cultivation Study: Surviving T Cells May Boost Immunity in Aging Leukemia Drug Reverses Tamoxifen-Resistance in Breast Cancer Cells Dr. Rory Cooper Senior Co-Editor of New Rehab Handbook to Assist Warrior Transition Leaders Breakthrough Discovery is Likely to Advance Medicine and Human Health Researchers Develop Mouse with 'Off Switch' in Key Brain Cell Population Specialized Regulatory T Cell Stifles Antibody Production Centers Survival of Stage-4 Breast Cancer Patients Improves With Stem Cell Treatment, Study Finds Skin Sentry Cells Promote Distinct Immune Responses MS Research: Myelin Influences How Brain Cells Send Signals Benign or Cancerous? Gene Test Predicts Cancer Potential in Pancreatic Cysts U of M Researchers Improve Method to Create Induced Pluripotent Stem Cells Dr. Fabrisia Ambrosio is a CELLebrity Doctor! Trial of Body Cooling For Cardiac Arrest from Massive Bleeding to Begin in Early 2012 Healing Heart News Geron to Focus on Oncology Programs Dr. Alan Russell, Inaugural Editor-in-Chief of New Peer-Reviewed Journal Mathematics Helps to Find Ways to Stop the Symptoms of Parkinsons Disease Technology for Adipose-Derived Stem Cell Production to Be Evaluated by McGowan Institute Faculty Clinical Trial of Molecular Therapy for Muscular Dystrophy Yields Significant Positive Results Dolphins' 'Remarkable' Recovery From Injury Offers Important Insights For Human Healing Gene Therapy to Reverse Heart Failure Ready for Clinical Trials Gene Therapy Delivered Once to Blood Vessel Wall Protects Against Atherosclerosis in Rabbit Studies Autoimmune Disease-Causing Cells Can Be Controlled Tumor Suppressor Protein is a Key Regulator of Immune Response and Balance New Technique Boosts Efficiency of Blood Cell Production from Human Stem Cells Precision Gene Targeting in Stem Cells Corrects Disease-Causing Mutations Bone Marrow Transplant Survival More Than Doubles for Young High-Risk Leukemia Patients Editing the Genome Stem Cells Restore Cognitive Abilities Impaired by Brain Cancer Treatment Progesterone Inhibits Growth of Neuroblastoma Cancer Cells Case Western Reserve University School of Medicine Restores Breathing After Spinal Cord Injury in Rodent Model Efficient Process Using microRNA Converts Human Skin Cells into Neurons, Study Shows Early-Stage Melanoma Tumors Contain Clues to Metastatic Potential Making Vegetables More Palatable for Malnourished Infants and Children Stephen Badylak: Singularity Summit Speaker on Regenerative Medicine Imaging Technology Might Help Doctors Determine Best Treatment for Crohns Disease Patients Regenerative Medicine a Part of Pitt School of Dental Medicine New Program Patent: Microsphere-Based Composition for Preventing and/or Reversing New-Onset Autoimmune Diabetes Regenerative Medicine Cell Therapy in Clinical Trial for Stable Stroke Patients A Change of Heart: Penn Researchers Reprogram Brain Cells to Become Heart Cells Stem Cell Therapy For Heart Disease Reduces Chest Pain, Increases Exercise Tolerance One-Pot Shot: Unique Gel Capsule Structure Enables Co-Delivery of Different Types of Drugs UF Scientists Devise Way to Sort Brain Cells for Potential Transplants Researchers Engineer Functioning Small Intestine in Laboratory Experiments Just Add Water and Treat Brain Cancer Scripps Research Scientists Solve Mystery of Nerve Disease Genes Mass. General Team Identifies New Class of Antiangiogenesis Drugs New Technique Advances Bioprinting of Cells Mutations Can Spur Dangerous Identity Crisis in Cells The Cancer Genome Atlas Completes Detailed Ovarian Cancer Analysis Telomeres: 2 Genes Linked to Why They Stretch in Cancer Cells UCSF-Led Team Decodes Evolution of Skin and Ovarian Cancer Cells Way to Make Bladder Cancer Cells More Susceptible to Chemotherapy Johns Hopkins Team Reconstitutes Single Stem Cells' Family Tree A Novel Airway Stem Cell Discovered by Scientists at the Broad Stem Cell Research Center at UCLA Scientists Discover New Molecular Pathway Involved in Wound-Healing and Temperature Sensation Mount Sinai Researchers Develop New Gene Therapy for Heart Failure Genome Editing, a Next Step in Genetic Therapy, Corrects Hemophilia in Animals Scientists Identify New Breast Cancer Tumor Suppressor and Explain How It Works Tiny Cell Patterns Reveal the Progression of Development and Disease Next Generation Gene Therapy: Penn Study Demonstrates Potential of New Gene Vector to Broaden Treatment of Eye Diseases Competition Between Brain Cells Spurs Memory Circuit Development Gold Nanoparticles Help Earlier Diagnosis of Liver Cancer Stem Cell Model Offers Clues to Cause of Inherited ALS Nanoparticles Working in Harmony Nanoparticles Disguised as Red Blood Cells Deliver Cancer-Fighting Drugs Signaling Pathway is 'Executive Software' of Airway Stem Cells Washington University Surgeons Successfully Use Artificial Lung in Toddler Stem Cells From Patients Make 'Early Retina in a Dish' Leaky Genes Put Evolution on the Fast Track, Researchers Find UC Davis Researchers Discover Target Molecule to Repair Injured Nerve Cells Low Levels of Iron-Binding Protein May Mean Better Outcome after Stem Cell Transplant for MDS Fear Boosts Activation of Young, Immature Brain Cells Glowing Cornell Dots A Potential Cancer Diagnostic Tool Set For Human Trials Turning Off Cancers Growth Signals Engineering Excitable Cells for Studies of Bioelectricity and Cell Therapy Removal of a Tiny Molecule Can Inhibit Cancer Growth Possible Susceptibility Genes Found in Neurodegenerative Disorder Brain-Computer Interface Permits Moving Thoughts Anti-Reflux Surgery Helps Airway Function Both Before and After Lung Transplant Generic Immunosuppressive Drug Safe for Transplant Recipients Potential Artificial Blood Products for Use in Hypothermia Induced During Surgeries Cohera Medical Receives European Union's CE Mark Approval Halting the Progress to Severe Sepsis New Stem Cell Research Could Aid in Battle Against Bulging Waistlines Researchers Report Progress Using iPS Cells to Reverse Blindness Picking Cancer Stems Cell Out of the Crowd Scientists Identify Surprising Function for Cyclin D1 in Cancer Genomic Comparison of Multi-Drug Resistant, Invasive Acinetobacter Reveals Genomic Plasticity Mutations in Essential Genes Often Cause Rare Diseases Social Scientists Study Impact of Human Adult Stem Cell Research Paper That Could Improve Gene Therapy Published Scientists Turn Human Skin Cells Directly Into Neurons, Skipping iPS Stage Human Brains Most Ubiquitous Cell Cultivated in Lab Dish Fred Hutchinson Cancer Research Center Scientists Discover New Drug Target for Squamous Cell Carcinoma Signaling Pathways Point to Vulnerability in Breast Cancer Stem Cells Breast Cancer Drug Pushes Colon Cancer Cells to Their Death Finnish Twin Study Yields New Information on How Fat Cells Cope With Obesity The Cellular Root of Colorectal Cancers? ASCO: Experimental Vaccine Made From Frozen Immune Cells Shows Promise for Prostate Cancer Patients Indiana University Neuroscientists Map a New Target to Wipe Pain Away Stem Cell Treatment May Offer Option for Broken Bones That Dont Heal Weight Loss After Gastric Bypass Surgery Reduces Expression of Alzheimers Genes NIH Scientists Reactivate Immune Cells Exhausted by Chronic HIV Minivectors Renew Gene Therapy Hopes for Lung Treatments A New Form of DNA Scientists Identify Overactive Genes in Aggressive Breast Cancers Vaccine and IL-2 Improve Response, Survival in Patients With Advanced Melanoma Stem Cells May Prevent Need for Joint Replacements, if FDA Allows It Vaccine Increases Disease-Free Survival for Follicular Lymphoma Patients Potential New Drug Candidate Found for Alzheimer's Disease Novel Pathway Regulates Angiogenesis - May Fight Retinal Disease, Cancer Scientists Find Genetic Basis for Key Parasite Function in Malaria New Biomaterial Invented That More Closely Mimics Human Tissue A Direct Path for Understanding and Treating Brittle Bones Researchers Create Nanopatch for the Heart Editing Scrambled Genes in Human Stem Cells May Help Realize the Promise of Combined Stem Cell-Gene Therapy U of M Experts Develop Technique to Duplicate Immunity Boosting Cells to Unprecedented Levels Artificial Tissue Promotes Skin Growth in Wounds Low-Dose Sorafenib May Improve Therapy for Head and Neck Cancer First Annual Symposium on Regenerative Rehabilitation to Be Held in Pittsburgh Patents Awarded to McGowan Institute for Regenerative Medicine Affiliated Faculty Members Pittsburghs Makeover: Education, Medicine, and Technology Revolutionizing Metallic Biomaterials Workshop on Mg-Based Screw Projects The Work of McGowan Institute for Regenerative Medicine Faculty Featured on the Discovery Channel Pitt Receives $3.54 Million Coulter Foundation Translational Bioengineering Research Award Regenerative Medicines Challenge to Cure: Post-Conference Workshop at Upcoming TERMIS-NA 2011 Clinical Use of New Brain-Scanning Technology Regenerative Medicine and ECM Highlighted in The Wall Street Journal Research Shows Removal of a Tiny RNA Molecule Can Inhibit Cancer Growth The Healing Power of Hydrogen Peroxide New Stanford Device Could Reduce Surgical Scarring The Dance of the Cells: A Minuet or a Mosh? Study of Stem Cell Diseases Advanced by New Stanford Technique Curcumin Compound Improves Effectiveness of Head and Neck Cancer Treatment Predicting the Fate of Personalized Cells Next Step Toward New Therapies New Technique Sheds Light on the Mysterious Process of Cell Division Team Discovers Key to Fighting Drug-Resistant Leukemia Success of Gene Therapy Will Depend on Ability to Advance Viral Delivery Vectors to Commercialization Scientists Design New Anti-Flu Virus Proteins Using Computational Methods Stem Cells Take Root in Livers and Repair Damage Researchers Identify Genes Linked to Worsening of Cystic Fibrosis Researchers Work to Prevent Blindness from Age-Related Macular Degeneration Common Anti-Inflammatory Coaxes Liver Cancer Cells to Commit Suicide Yale Scientists Discover New Method for Engineering Human Tissue Regeneration Disruption of Nerve Cell Supply Chain May Contribute to Parkinsons Scientists Use Genetically Altered Virus to Get Tumors to Tattle on Themselves Scientists Unmask Mysterious Cells as Key 'Border Patrol Agents' in the Intestine Single Bioptic Telescope for Low Vision Driving May Not Obscure Road View of Second Eye Going Blind: Upcoming Movie Screening and Panel Discussion Regenerative Medicine Medical Device Start Up Receives Funding Boost Team Describes How Tooth Enamel Forms Regenerative Medicine: Regrowing Blood Vessels with a Potent Molecule Scientists for the First Time Regenerate Sections of Retinas and Increase Visual Function With Stem Cells Derived From Skin Personal Tonometer Technology for Innovative Glaucoma Testing Licensed Leucine Deprivation Proves Deadly to Malignant Melanoma Cells Study Finds Therapies Using Induced Pluripotent Stem Cells Could Encounter Immune Rejection Problems "Fasting Pathway" Points the Way to New Class of Diabetes Drugs Pluripotent Adult Stem Cells Power Planarian Regeneration Human Lung Stem Cell Discovered Non-Human Primate Studies Reveal Promising Vaccine Approach for HIV Microbubble-Delivered Combination Therapy Eradicates Prostate Cancer in Vivo Johns Hopkins Scientists Reveal Nerve Cells' Navigation System Rutgers Offers Hope in New Treatment for Spinal Cord Injuries In a Genetic Research First, Mayo Clinic Turns Zebrafish Genes Off and On Columbia Engineers Patch a Heart Research Scientists Show How Shifts in Temperature Prime Immune Response Advanced Instrument Used to Read Cells' Minds Stem Cell-Related Changes That May Contribute to Age-Related Cognitive Decline Identified What Decides Neural Stem Cell Fate? Antibodies Help Protect Monkeys From HIV-Like Virus, NIH Scientists Show Direct Proof of How T Cells Stay in 'Standby' Mode Researcher Measures Estrogen's Effect on Breast Cancer Cells Hitting Target in Cancer Fight Now Easier With New Nanoparticle Platform Nanovaults Used to Prod Immune System to Fight Cancer Nanoparticle Boosted T-Cells Take on Cancer Jackson Laboratory Team Finds Genetic Clue to 'Emergency' Glaucoma Researchers Discover Mechanism That Could Convert Certain Cells Into Insulin-Making Cells Removable Cloak for Nanoparticles Helps Them Target Tumors Finding Molecular Targets of an HIV Drug Used in Cancer Therapy University of Michigan Study Shows Promise for Developing Protein Therapies for Disease Prevention UCSB Scientists Discover New Drug Target for Kidney Disease Gladstone Scientist Makes Key Innovations in Stem-Cell Technology Scientists Develop Compound That Effectively Halts Progression of Multiple Sclerosis Scientists Create Stable, Self-Renewing Neural Stem Cells Blocking Crucial Molecule Could Help Treat Multiple Sclerosis Research Discovery May Block ALS Disease Process A Cancer Marker and Treatment in One? Celebrating 10 Years of Regenerative Medicine at the McGowan Institute Esophageal Cancer Risk Higher in Medically Treated GERD Patients with Fewest Symptoms Team Discovers Why Stored Blood May Become Less Safe for Transfusion as it Ages Regenerative Medicine Trial: Stem Cell Injections May Offer Hope to Patients with No Other Options Gene Therapy Shows Promise Against Age-Related Macular Degeneration New Gene Therapy Technique on iPS Cells Holds Promise in Treating Immune System Disease As the Worm Turns, Its Secrets Are Revealed Versatility of Stem Cells Controlled by Alliances, Competitions of Proteins Researchers Identify Key Players in Cancer Cells' Survival Kit Stem Cell Discoveries Pace Growing Understanding of Human Brains Uniqueness Brain Cell Migration During Normal Development May Offer Insight on How Cancer Cells Spread DNA Nanoparticles to Carry Drugs and Gene Therapy Researchers Engineer Cells Own Vault Nanoparticles to Deliver Cytotoxic Drugs Researchers Construct RNA Nanoparticles to Safely Deliver Long-Lasting Therapy to Cells New Study Finds Better Strategy for Lymphoma Immunotherapy Decoding Cancer Patients Genomes is Powerful Diagnostic Tool Anti-Depressants Boost Brain Cells After Injury in Early Studies Sandia and UNM Lead Effort to Destroy Cancers Tinnitus Caused by Too Little Inhibition of Brain Auditory Circuits, Pitt-led Study Says NIH Scientists Identify Gene That Could Hold the Key to Muscle Repair New Therapy Improves Immune Response in Teen with Rare Disease Study Suggests Enzyme Crucial to DNA Replication May Provide Potent Anti-Cancer Drug Target Scientists Recreate Brain Cells from Skin Cells to Study Schizophrenia Pig Stem Cell Transplants: The Key to Future Research Into Retina Treatment CSHL Team Perfects Non-Lethal Way of Switching Off Essential Genes in Mice First Clinical Trial of Gene Therapy for Pain Reported by U-M Neurologists Universal Virus-Free Method Turns Blood Cells to Beating Heart Cells Study Shows Patients Own Cells May Hold Therapeutic Promise After Reprogramming, Gene Correction Microbial Fuel Cell May Power Medical Implants One Day Algae May Be the Solution to Blindness Enhanced Cord Blood Stem Cell Transplants Safe in Long-Term Studies Researchers Inject Nanofiber Spheres Carrying Cells into Wounds to Grow Tissue New Evidence That Chronic Ulcerative Stomatitis is an Autoimmune Disease Discovery of Two New Genes Provides Hope for Stemming Staph Infections Scientists Identify a Surprising New Source of Cancer Stem Cells Big Picture of How Interferon-Induced Genes Launch Antiviral Defenses Revealed Helping the Heart Help Itself Tissue Engineers Use New System to Measure Biomaterials, Structures A New Way to Make Reprogrammed Stem Cells New Research Holds Promise for Gene Engineering and Therapy New "Nanodrug" Breaks Down Barriers to Attack Breast Cancer Cells From the Inside Out New Nanoscale Tool May One Day Build Molecular Structures That Treat Disease Stem Cell Therapy for Age-Related Macular Degeneration -- A Step Closer to Reality Systems Biologists Predict Complicated Behavior of Cells in Living Animals Researcher Creates Personalized Therapy That Causes Cancer Cells to Kill Themselves Celebrating Transplantation Study: Race Might Not Influence Life-Sustaining Treatment Decisions in End-Stage Cancer Healing Through Regenerative Medicine Bioengineering Innovation and Commercialization Program New Technology Could Inspire Brain Implant for Detecting and Treating Seizures Telepathology Provides Remote, Second-Opinion Pathology Consultations to China Vitamin D Levels Associated With Age-Related Macular Degeneration Vision Loss in Eye Disease Slowed Using Novel Encapsulated Cell Therapy Scientists Find Potential Driver of Some Aggressive Prostate Cancers 'Good Cholesterol' Nanoparticles Seek and Destroy Cancer Cells 'SKIP'-ing Splicing Forces Tumor Cells to Undergo Programmed Cell Death Researchers Make the Leap to Whole-Cell Simulations Investigators Discover Enzyme Essential for Healthy Lung Development Fat Fate: Researchers Uncover Signal That Helps Control When Stem Cells Become Fat Cells Researchers Find Eye Development Error Causing Cataracts, Glaucoma Stem Cell Research May Lead to New Treatments for Parkinson's Disease, Huntington's Disease, Multiple Sclerosis, Stroke, Spinal Cord Injury Stanford Researchers Discover Molecular Determinant of Cell Identity Tet Further Revealed: Studies Track Protein Relevant to Stem Cells, Cancer Scientists Target Aggressive Prostate Cancer Computer Models Used in Drug Discovery Efforts New Pacemaker Permits MRI Scans Bird Embryo Provides Unique Insights into Development Related to Cancer and Wound Healing New Imaging Technique Provides Rapid, High-Definition Chemistry Mutant Prions Help Cells Foil Harmful Protein Misfolding Gene Therapy Reverses Symptoms of Parkinson's Disease Johns Hopkins Team Creates Stem Cells from Schizophrenia Patients Enzyme Can Steer Cells or Possibly Stop Them in Their Tracks Dine or Dash? Genes Help Decide When to Look for New Food New Therapy Found for Rare Lung Disorder Malaria Drug Slows Pancreatic Cancer Growth in Mouse Models Stroke Incidence Higher Among Patients with Certain Type of Retinal Vascular Disease UCSF Report Describes New Model for Neurodegeneration Cerebral Spinal Fluid Guides Stem Cell Development in the Brain Scientists Identify Molecule that Can Increase Blood Flow in Vascular Disease Using Stem Cells to Regrow Muscle, Bone Columbia Engineer Observes Surprising Behavior of Cells During Blood-Vessel Formation Scientists Discover Key to Effective Meningitis Vaccine Boosting Protein Garbage Disposal in Brain Cells Protects Mice from Alzheimer's Disease Laboratory-Grown Urethras Implanted in Patients, Scientists Report Transplanting Umbilical Cord and Menstrual Blood-Derived Stem Cells Offer Hope for Disorders New Instrument Keeps an 'Eye' on Nanoparticles New Clue to Controlling Skin Regeneration--as Well as Skin Cancer New Method Allows Human Embryonic Stem Cells to Avoid Immune System Rejection Scientists Create Neurons with Symptoms of Parkinson's Disease From Patient's Skin Cells T-Cell Immunotherapy: Researchers Predict Age of T Cells to Improve Cancer Treatment Aging, Interrupted Task Force Position on Stem Cell Therapies in Aesthetic Medicine Stem Cells May Provide New Treatment for Children With Severe Brain Injuries Cardiac Catheter That Can Do It All A New Stem Cell Enters the Mix: Induced Conditional Self-Renewing Progenitor Cells Gene Therapy Boosted Brain Cell Disposal of Toxic Proteins and Protected Mice From Alzheimer's New Microscope Produces Dazzling 3-D Movies of Live Cells Star-Shaped Brain Cells Feed Long-Term Memory Human Stem Cells Transformed Into Key Neurons Lost in Alzheimer's Spinal Cord Injury: Human Cells Derived from Stem Cells Restore Movement in Animal Models Small Subset of Normal White Blood Cells that Gives Rise to a Rare Incurable Form of Leukemia Identified How Long Do Stem Cells Live? Alzheimer's Risk Looks Higher if Mom Had the Disease Study Identifies Genes Associated With Binge Drinking Johns Hopkins Scientists Tie Cell Cycle Clock to Childhood Cancers Newborn Heart Muscle Can Grow Back by Itself, UT Southwestern Researchers Have Found Scientists Devise Artificial Intestine to Help Engineer Disease-Fighting Gut Bacteria Vaccine Made With Synthetic Gene Protects Against Deadly Pneumonia Nano-Sized Vaccines Applied Physicists Discover That Migrating Cells Flow Like Glass Scientists at Childrens Hospital Los Angeles Bioengineer a Protein to Fight Leukemia Stem Cell Transplants Help Kidney Damage Addiction to Life-Saving, Self-Digestion Process Can Aid Cancer Cells in Tumor Growth Tumor Microvesicles Reveal Detailed Genetic Information Minimally Invasive Esophagectomy Leads to Low Mortality Clinical Practice Guidelines on Acute Kidney Injury Announced Potential New Drug Treats Blood Disorders by Halting Overproduction of Blood Cells Hyperactive Nerve Cells May Contribute to Depression Scripps Research Study Sheds Light on RNA On/Off Switches A New Way to Attack Pathogens Nanoparticles May Enhance Circulating Tumor Cell Detection Human and Mouse Studies Sharpen Focus on Cause of Celiac Disease Insight Into Major Cause of Age-Related Blindness Searching for the Soul of the Genome Skin Cells Help to Develop Possible Heart Defect Treatment in First-of-its-Kind Study Identification of Glaucoma Gene Brightens View for Future Therapies Study: 1 Person of 1,900 Met AHA's Definition of Ideal Heart Health Tissue Engineering Methods Earn Funding to Heal Little Hearts Study Suggests Statins May Prevent Diabetic-Related Blindness Overabundance of Protein Expands Breast Cancer Stem Cells Key to How Cells, Including Cancer, Migrate and Invade the Body Discovered Omega 3's - More Evidence for Their Benefit Regenerative Medicine and the Body Future Collaborative Grant Will Help Move Towards Clinical Heart Study Stem Cells Released to Heal Wounds Could Trigger Tumors Research First to Combine Targeted Agents to Kill Multiple Myeloma Cells Researchers Turn Salmonella Into Anti-Viral Gene Therapy Agent New Probiotic Combats Inflammatory Bowel Disease Cells' Energy Factories Linked to Damaging Inflammation A Guide Star Lets Scientists See Deep Into Human Tissue Conceptualizing Cancer Cells as Ancient 'Toolkit' Value of iPS Cells Proved in Two Studies Study Finds a Stem Cell Origin of Skin Cancer and the Genetic Lesions That Promote its Malignancy Scientists Unlock One Mystery of Tissue Regeneration New Induced Stem Cells May Unmask Cancer at Earliest Stage Cell Reprogramming Leaves a "Footprint" Behind NIH Researchers Identify Genetic Cause of New Vascular Disease MicroRNA Cocktail Helps Turn Skin Cells Into Stem Cells Researchers Unlock the Potential for Exploring Kidney Regeneration Johns Hopkins Researchers Develop Safer Way to Make Induced Pluripotent Stem Cells NIH Researchers Extend Use of Gene Therapy to Treat a Soft Tissue Tumor Adult Skin Cells Converted Directly to Beating Heart Cells Growth-Factor-Containing Nanoparticles Accelerate Healing of Chronic Wounds Caffeine Energizes Cells, Boosting Virus Production for Gene Therapy Applications With Chemical Modification, Stable RNA Nanoparticles Go 3-D Regenerative Medicine: Stronger Self-Healing Materials by Adding More Give Successful Partnership: Bioengineering and Regenerative Medicine Pivotal Discoveries in Age-Related Macular Degeneration Bioengineered Veins Could Help Patients Needing Bypass Surgery, Dialysis All in the Family: Lower Back Disease May Be in Your Genes Breast Cancer Cells Outsmart the Immune System and Thrive Engineered Cells Could Usher in Programmable Cell Therapies Salk Researchers Discover That Stem Cell Marker Regulates Synapse Formation Stem Cells Show Promise in Repairing a Child's Heart UABs New 3-D Nanoscaffold Could Revolutionize Human Tissue Engineering Nano-Based Filtration System Removes Circulating Tumor Cells HIV Causes Rapid Aging in Key Infection-Fighting Cells, Research Suggests Adult Kidney Stem Cells Found in Fish Novel Effort to Fight Cancer with Cancer Cells UCLA Researchers Eliminate Major Roadblock in Regenerative Medicine Study Raises Safety Concerns About Experimental Cancer Approach Research Into Synthetic Antibodies Offers Hope for New Diagnostics Purdue Team Creates 'Engineered Organ' Model for Breast Cancer Research Putting Up a Struggle Against Cancer Molecular Battle in Cancer Cells Offers Clues for Treatment UCSF Team Views Genome as It Turns On and Off Inside Cells Regenerative Benefit of MultiStem Therapy After Spinal Cord Injury Shown Mothers Stem Cells Likely Key to Treating Genetic Disease Before Birth Researchers Find Indirect Path to Attack Breast Cancer Stem Cells Experimental Radioprotective Drug Safe for Lung Cancer Patients New Technology to Treat Aortic Heart Valve Disease without Open Heart Surgery New Molecule Could Save Brain Cells From Neurodegeneration, Stroke Special Sugar, Nanoparticles Combine to Detect Cholera Toxin In Scientific First, Researchers Visualize Naturally Occurring mRNA MicroRNA Suppresses Prostate Cancer Stem Cells and Metastasis Scientists Sequence Gut Microbes of Premature Infant Enzyme Inhibition or Removal May Prevent or Treat Ischemic Retinopathy Antibiotics Best Treatment for Ear Infections in Toddlers, Study Finds Biomedical Breakthrough: Blood Vessels For Lab-Grown Tissues Steroid Reduces Noninfectious Uveitis Positive Results for Adipose Derived Stem Cells in Critical Limb Ischemia Reported UNC Researchers Inch Closer to Unlocking Potential of Synthetic Blood Extracting Cellular 'Engines' May Aid in Understanding Mitochondrial Diseases Ocular Regenerative Medicine Focus of Fox Center for Vision Restoration TBI Therapy is Focus of Clinical Trial Regenerative Medicine Reconstructs Soft-Tissue in Wounded Warriors Multi-State Kidney Chain: 32 Operations and 16 Transplants Redesign of U.S. Liver Allocation Regions Benefits More Transplant Patients Researchers Eliminate Major Roadblock in Regenerative Medicine Stanford Joins First Embryonic-Stem-Cell Therapy Clinical Trial Conversion of Brain Tumor Cells into Blood Vessels Thwarts Treatment Efforts Go Figure: Math Model May Help Researchers with Stem Cell, Cancer Therapies Cancer-Fighting Role for Cells Discovered Does Our DNA Determine How Well We Respond to Stem-Cell Transplantations? Research Shows When Stem Cell Descendants Lose Their Versatility McGowan Institute-Developed TechnologyThe Hemolung Respiratory Assist SystemUsed as a Successful Bridge to Lung Transplant Regenerative Medicine Find: Mammalian Newborn Heart Can Heal Itself Regenerative Medicine Using Platelet-Rich Plasma Brain-Computer Interfaces for Patients with Spinal Cord Injuries: Funded Projects Better Understanding of Interaction of Human Immune System with HIV Gained Overexpression of Repetitive DNA Sequences Discovered in Common Tumor Cells Biomedical Breakthrough: Blood Vessels for Lab-Grown Tissues Better Way to Treat Deadly Brain Tumors? Embryonic Stem Cells are a Potentially Unlimited Source of Functional Platelets for Transfusion Patient-Derived Embryonic Stem Cells Help Deliver Good Genes in a Model of Inherited Blood Disorder Pandemic Flu Strain Could Point Way to Universal Vaccine Mutation in Chaperone Proteins that Lead to Major Developmental Abnormalities Scientists Uncover Inherent Properties of Cell Signaling Pathways Study Findings May Have Significant Implications for Brain Repair and Abnormal Brain Development Researchers Pinpoint Origin of Deadly Brain Tumor Scientists Construct Synthetic Proteins that Sustain Life Genetic Abnormalities Identified in Pluripotent Stem Cell Lines Stem Cell Discovery Could Lead to Improved Bone Marrow Transplants Safety Study: Cord Blood Stem Cells for Pediatric Traumatic Brain Injury Baylor Researchers Take Step Forward in Diabetes Study Male Pattern Balding May Be Due to Stem Cell Inactivation, According to Penn Study Protein Wields Phosphate Group to Inhibit Cancer Metastasis Peptide Delivers 1-2 Punch to Breast Cancer in Pre-Clinical Study Novel Therapy for Metastatic Kidney Cancer Developed "Magnetic Sponge" Could be New Form of Drug and Cell Delivery Gene Activity May Affect Acute Myeloid Leukemia Outcome Malaria-Infected Cells Stiffen, Block Blood Flow Blocking the Critical Structure That Lets Cancer Cells Move -- Their Feet Researchers Find New Source of Immune Cells During Pregnancy Protein Disables p53, Drives Breast Cells Toward Cancer Transition Nanotube Probe for Living Cells Can Advance Drug Discovery Protein Offers New Clue to Cause and Treatment for Kidney Disease New Mouse Model for Duchenne Muscular Dystrophy Implicates Stem Cells There's a New 'Officer' in the Infection Control Army Reproductive Scientists Create Mice From 2 Fathers Study of How Genes Activate Yields Surprising Discovery Anterior Cruciate Ligament Reconstruction Focus of Clinical Trial Project to Develop Software to Improve Management of Heart Patients Funded Regenerative Medicine Milestone: Arteries Grown With Highest Level of Elastic Protein Reported Grant for Esophageal Research Awarded to Dr. Blair Jobe Treatment with 2 Medications Improves Cognition, Reduces Incidence of Dementia in Older Adults How Cells Running on Empty Trigger Fuel Recycling Gene Signature May Help Predict Leukemia Outcomes Ovarian Cancer Advances When Genes Are Silenced Missing Molecules Hold Promise of Therapy for Pancreatic Cancer Early Disease Detection and Drug Delivery Device for Single Living Cells Created Nanoscale Gene "Ignition Switch" May Help Spot and Treat Cancer Killing Drug-Resistant Melanoma Requires Combination Therapy Stem Cells Turned Into Complex, Functioning Intestinal Tissue in Lab National Team of Scientists Peers into the Future of Stem Cell Biology Bioactive Peptides Found to Promote Wound Healing Revolutionizing Pathology Rabies Helps Scientists Understand the Brains Neurologic Circuitry Scripps Research Scientists Home In on Chemicals Needed to Reprogram Cells New Function of Gene in Promoting Cancer Found by VCU Researchers Researchers First to Turn Normal Skin Cells Into Three-Dimensional Cancers in Tissue Culture Dishes Regenerative Medicine Grant: Curbing Breast Cancer Metastasis with Drag-Reducing Polymers Regenerative Medicine Medical Device Focus of Heart Assist Study Paper Represents the Avant-Garde in the Field of Precision Macromolecular Chemistry Medical Devices Made with Self-Healing Materials Radiosurgery: A Potential, Valuable New Option for Most Severe Cases of OCD Cellular Imaging Techniques Highlight Regenerative Medicine Research Bridge to Independence: Regenerative Medicine Vision Device Too Much Retinoic Acid Disrupts Development in Zebrafish Embryos Ovarian Cancer Advances When Genes are Silenced A 'Stitch in Time' Could Help Damaged Hearts Different Origins Discovered for Medulloblastoma Tumor Subtypes Ultraviolet Light Helps Skin Cancer Cells Thrive, Researchers Report 'Shotgun' Method Allows Scientists to Dissect Cells' Sugar Coatings Studies Lend New Insights into Biology of Wound Pain and Healing Using Nanotechnology to Improve Cancer Treatment Researchers Achieve Extensive Regeneration in Nerve Connecting Eye to Brain Mechanism That Transforms Healthy Cells into Prostate Cancer Discovered Scientists Map Changes in Genetic Networks Caused by DNA Damage Tumors Bring Their Own Support Cells When Forming Metastases Tiny RNA Shown to Cause Multiple Types of Leukemia Scientists Report Partial Reversal of Age-Related Degeneration in Aged Mice Researchers Identify a Molecular Switch That Controls Neuronal Migration in the Developing Brain Researchers Shine Light on How Some Melanoma Tumors Evade Drug Treatment Restoring the Gene for Cancer Protein P53 Slows Spread of Advanced Tumors Finger-Trap Tension Stabilizes Cells' Chromosome-Separating Machinery Discovery Halts Breast Cancer Stem Cells Findings Suggest New Cause, Possible Treatment for Multiple Sclerosis In the Test Tube, Teams Reconstruct a Cancer Cells Beginning New Study into Bladder Regeneration Heralds Organ Replacement Treatment Gene Therapy Prevents Memory Problems in Mice with Alzheimer's Disease Rare Disease Reveals New Path for Creating Stem Cells New Path Found for Colon Cancer Drug Discovery Gene Modified Stem Cells Cure Melanoma in Mice Rett Syndrome Mobilizes Jumping Genes in the Brain Bioengineers Provide Adult Stem Cells with Simultaneous Chemical, Electrical, and Mechanical Cues Tiny RNA Molecules Control Labor, May Be Key to Blocking Premature Birth How Do Neural Stem Cells Decide What To Be -- and When? Embryonic Stem Cell Culturing Grows From Art to Science Modeling Autism in a Dish Rare Syndrome Aided by Stem-Cell Gene Therapy Researcher Discovers Potential New Target for Therapy for Aggressive Prostate Cancer Gene Identified for Spread of Deadly Melanoma Dr. Bryan Tillman Honored with Wylie Scholar in Academic Vascular Surgery Award Regenerative Medicine Work Feature of NatGeo Program, Monday, February 7, 2011 Bodiography Contemporary Ballet: A Regenerative Medicine Collaboration Improving the Supply of Donor Organs New Low-Cost Method to Deliver Vaccine Shows Promise Microsensors Offer First Look at Whether Cell Mass Affects Growth Rate Researchers Grow Rett Syndrome in a Petri Dish Successful Gene Therapy for an Immune Disease A New Read on DNA Sequencing Paper Wins AMIA Award Mathematical Model of the Life Cycle of Red Blood Cells May Predict Risk of Anemia Researchers Discover Key Mutation in Acute Myeloid Leukemia Stem Cell Transplants in Mice Produce Lifelong Enhancement of Muscle Mass Specialized Blood Vessels Jumpstart and Sustain Liver Regeneration Scientists Discovered How Stem Cells Respond to Nutrient Availability Small Protein Changes May Make Big Difference in Natural HIV Control Scientists Find Nerve Cell Activity Drains Stem Cell Pool in Developing Brain New Lymphoma Therapy May Be More Effective With Fewer Side Effects Study Investigates Risk Management in Regenerative Medicine Study: NSAIDs Cause Stem Cells to Self-Destruct, Preventing Colon Cancer Of 50,000 Small Molecules Tested to Fight Cancer, 2 Show Promise Non-Small Cell Lung Cancer Study Highlights Advances in Targeted Drug Therapy Researchers Engineer Miniature Human Livers in the Lab Regenerative Medicine Medical Device: Artificial Lung Saves 6-Year-Old Patient iPSCs to Further Treatments for Lung Disease Generated Immune System's Bare Essentials Used to Speedily Detect Drug Targets Controlling Individual Cortical Nerve Cells by Human Thought Too Much SP2 Protein Turns Stem Cells into Evil Twin Tumor-Forming Cancer Cells The World is Not Flat: Exploring Cells and Tissues in Three Dimensions Researchers Identify Gene Variants with Important Role in Childhood Obesity Gene Variations That Alter Key Enzyme Linked to Prostate Cancer Research on Killer HIV Antibodies Provides Promising New Ideas for Vaccine Design Proteins to Yield New Clues in Fight Against Osteoporosis Triple-Negative Breast Cancers May Have Unique Therapeutic Target Synthetic FlexBone Could Help Speed Bone Transplant Recovery UT MD Anderson Scientists Show TAp63 Suppresses Cancer Metastasis Gene Therapy May Be Powerful New Treatment for Major Depression Bioelectrical Signals Turn Stem Cells' Progeny Cancerous Key Difference in How TB Bacteria Degrade Doomed Proteins Promise of Outpatient Brain Gene Therapy is One Step Closer Gene Identified That Prevents Stem Cells from Turning Cancerous Study Finds Gene Associated With Aggressive Skin Cancer Yale Researchers Find Protein is a Key Tool in Chromosomal Repair Kit Researchers Create First Molecule Able to Block Key Component of Cancer Genes' On-Off Switch Molecules Involved in Touch and Other Mechanically Activated Systems Identified Molecule 968 Binds Glutaminase and Starves Cancer Cells Researchers Identify Genetic Marker of Aggressive Alzheimers Disease Origin of Sporadic Breast Cancer No Difference Found in Drugs for Macular Degeneration Inhibiting Cell Signaling Pathway May Improve Bone Marrow Transplant Success Rate Researchers Discover New Signaling Pathway That Controls Cell Development and Cancer Researchers Find Faster, Less-Intrusive Way to Identify Transplant Recipients' Organ Rejection Nanotechnology Brings Personalized Therapy One Step Closer to Reality Northwestern First Site Open for Spinal Cord Stem Cell Trial OHSU Research Suggests Compound Administered During Some Bone Marrow Transplants Elevates Risks Mice Engrafted with Human Immune Cells May Provide Clues to Better Prevention and Treatment of Typhoid Fever Researchers Map Thousands of MAPK Protein Interactions Researchers Build Artificial Ovary to Mature Human Eggs Report: Lung Cancer Culprit Could Offer Target for Therapy Cloud Computing Method Greatly Increases Gene Analysis New Gene for Memory Identified With HMGB1's Help, Cells Dine In Researchers Illuminate Operation of Molecular Gateway to the Cell Nucleus Scientists Reveal First Structure of a Class of Proteins That Help Guide Blood Cell Movement Sodium Plays Key Role in Tissue Regeneration Regenerative Cellular Therapy in Chronic Kidney Disease Extends Survival Regenerative Medicine: Helping Soldiers Who Have Lost Limbs in Combat Technique to Reattach Teeth Using Stem Cells Developed 'Gold' fish thrive, cancers die 'Synthetic Lethality' Strategy Improves Molecularly Targeted Cancer Therapy Scientists Find Genes Related to Body Mass Grant Sparks Hope for Incurable Disease Researchers Identify Genes Tied to Deadliest Ovarian Cancers Caltech Scientists Create New Process to "Program" Cancer Cell Death Model for Implantable Artificial Kidney to Replace Dialysis Unveiled by UCSF U-M Researchers Receive Largest Single Collection of Psoriasis DNA Samples Remodeling the Human Body with Regenerative Medicine and Tissue Engineering New Digital Pathology Technology in Clinical Research Testing Sepsis Survivors Likely to Have Cognitive Issues Keeping Stem Cells From Changing Fates Induced Pluripotent Stem Cells Retain an Inactivate X Chromosome Researchers Find Solution to Cell Death Problem Vexing Stem Cell Research Gene Scan Helps Identify Cause of Inherited Blindness Biomedical Research Policy Needed for Therapies, Economic Growth, Education, and Security Live Imaging Puts New Light on Stem Cell Division Biologists Find Way to Reduce Stem Cell Loss During Cancer Treatment New Study Sheds Light on Painkilling System in Brain Double-Therapy Approach Developed Effectively Inhibited Brain Cancer Recurrence Gene Involved in Fuchs Corneal Dystrophy is Found Gene Scan Finds Link Across Array of Childhood Brain Disorders New Generation of Sophisticated and Lifelike Prosthetic Arms Researchers Identify How Bone-Marrow Stem Cells Hold Their 'Breath' in Low-Oxygen Environments Researchers Identify Genes Associated with Asthma Functional Motor Neuron Subtypes Generated From Embryonic Stem Cells Cancer-Causing Gene Is Also Crucial in the Development of Stem Cells Why Fish Oils Work Swimmingly Against Diabetes Scientists Discover the Mechanisms and Function of a Type of Mysterious Immune Cell Novel Nanotechnology Collaboration Leads to Breakthrough in Cancer Research Scientists Unveil Structure of Adenovirus, the Largest High-Resolution Complex Ever Found Study Points to Key Genetic Driver of Severe Allergic Asthma Yale Team Finds a Genetic Rarity: A Mutation That Restores Health Targeted Drug Leads to Rapid Regression of Metastatic Melanoma in Patients With Mutated BRAF Gene Use the Common Cold Virus to Target and Disrupt Cancer Cells? Mount Sinai Hospital Researcher Discovers Key Protein Involved in DNA Damage and Repair Discovery Opens Door to Therapeutic Development for FSH Muscular Dystrophy Human Neural Stem Cells Restore Motor Function in Mice with Chronic Spinal Cord Injury Study of Cell Division Sheds Light on Special Mechanism in Egg Cells RNA Snippets Control Protein Production by Disabling mRNAs Selected Cells from Blood or Bone Marrow May Provide a Route to Healing Blood Vessels Regenerative Medicine Medical Device: BrainPort Vision Device Receives $3.2M for R&D Researchers Develop a Better Way to Grow Stem Cells Surprise in Genome Structure Linked to Developmental Diseases Patient Symptoms Are Not Reliable Indicators of Crohns Disease Recurrence Researchers Use Stem Cells to Treat Children with Life-Threatening, Blistering Skin Disease A Strategy to Fix a Broken Heart Pediatric Acute Liver Failure Focus of NIH Grant Researchers Find No Difference in Drugs for Macular Degeneration Clues to How Bacteria and Viruses Are Identified as Enemies Revealed Research Concludes Vitamin D May Treat or Prevent Allergy to Common Mold Adult Stem Cells Vital for Lung Repair Associated With Poor Cancer Prognosis When Found in the Tumor A Heart Beats to a Different Drummer A Lethal Brain Tumor's Strength May Be a Weakness as Well Retinal Degeneration Can Be Prevented With Nanotechnology Gene Therapy Discovered Gene Causes Kabuki Syndrome Merlin Protein Found to Control Liver Stem Cells, Prevent Tumor Development Stem Cell Technology Yields First Knockout Rats Human Cells Can Copy Not Only DNA, But Also RNA, Say Researchers MicroRNA Molecule Increases Number of Blood Stem Cells, May Help Improve Cancer Treatment NIH Genomic Mapping Study Finds Largest Set of Genes Related to Major Risk Factor for Heart Disease Scientists Develop Designer Protein, Opening New Door in Cancer Research Scientists Target Possible Cause of One Form of Bowel Disease UCSD Scientists Find Gas Pedal--and Brake--for Uncontrolled Cell Growth Diagnosing and Treating Glaucoma Indian Medical Team to Receive Regenerative Medicine Training Knee Repair Regenerative Medicine Research Efforts Regenerative Medicine and Breast Reconstruction Regenerative Medicine Helps Heal Hand Transplant Patients One Type of Stem Cell Creates a Niche for Another Type in Bone Marrow Researchers Discover Protein That Shuttles RNA Into Cell Mitochondria New Method for Regenerating Heart Muscle by Direct Reprogramming Discovered Human Embryonic Stem Cells Purified in New, Rapid Technique Does Higher Body Weight Protect Women From One Type of Glaucoma? Alphavirus-Based Vaccine may Slow Some Cancers Epileptic Seizures may be Linked to an Ancient Gene Family Key Step in Body's Ability to Make Red Blood Cells Found Researchers Identify Key Enzyme in DNA Repair Pathway Molecular Mechanism Triggering Parkinson's Disease Identified in Study One Molecule, Many More Insulin-Producing Cells to Treat Diabetes Clean Genes: Michigan Tech Chemist Culls the Good Synthetic DNA From the Bad Commercial Mind-Reading Tools Nothing Like Those Used in Scientific Research Labs New Imaging Technique Could Help Physicians Ease the Aftermath of Breast Cancer Red Blood Cells Protected From Injury by MicroRNA New Insights Into How Stem Cells Determine What Tissue to Become Revolutionary Findings Prove Novel Mechanism of Stem Cells Scientists at UCLA Find Cell of Origin for Human Prostate Cancer NIH-Funded Researchers Make Progress Toward Regenerating Tissue to Replace Joints RNA Offers a Safer Way to Reprogram Cells Natural Substance NT-020 Aids Aging Brains in Rats, Study Finds New Model of Leukemia Sheds Light on Possible Novel Treatment Targets NIH Study: Gene Associated With Rare Adrenal Disorder Appears to Trigger Cell Death Small Molecule Boosts Production of Brain Cells, Protects New Cells From Dying Cells Are Virtually Identical MicroRNA Molecule Increases Number of Blood Stem Cells, May Help Improve Cancer Treatment Newts Ability to Regenerate Tissue Replicated in Mouse Cells by Scientists Unearthing King Tet: Key Protein Influences Stem Cell Fate Discovery Suggests Possible Treatment Strategy for Aggressive Leukemias St. Jude Scientists Develop New Genomics-Based Approach to Understand the Origin of Cancer Subgroups Researchers Find Way to Make Cancer Cells More Mortal Scientists Develop New Way to Grow Adult Stem Cells in Culture After 40 Years, NIH-Supported Researchers Identify Possible New Treatment for Severe Vasculitis Researchers Create Tumor-Fighting Immune Cells, Watch in Real Time as They Kill Cancer Biologists Identify a New Clue Into Aging Process Cell Signaling Classification System Gives Researchers New Tool Mount Sinai Hospital Scientists Uncover Important Clues in the Biology of Stem Cells Reprogrammed Human Blood Cells Show Promise for Disease Research Mechanism That May Trigger Degenerative Disease Identified Regenerative Medicine Grant: 3D Culture of Adipose Tissue for Screening Obesity-Related Drugs RNA Offers a Safer Way to Reprogram Cells Irradiating Brain's Stem Cell Niche Doubles Survival Time for Patients With Brain Cancers Study Ties Abnormal Cells in Blood to Lung Cancer Researchers Discover Role for Epigenetics in Cellular Energy Regulation Gene Linked to Aging Also Linked to Alzheimers First Stages of Tissue Production from Human Embryonic Stem Cells Isolated Yale Scientists Discover New Genetic Marker of Ovarian Cancer Risk Healthy Dividing Cells Spontaneously Trigger Tumor Suppressor High-Performance Engineering Used to Design Facial Bone Replacements Protein That Predicts Prognosis of Leukemia Patients May Also Be a Therapeutic Target Antibodies That Prevent Most HIV Strains From Infecting Human Cells Found Taking a Hard Look at Soft-Tissue Sarcomas Normal Adult Blood Can Generate Pluripotent Stem Cells, Study Reports Gene Regulating Human Brain Development Identified Cancer Stem Cells Are Not One-Size-Fits-All, Lung Cancer Models Show Melanoma-Initiating Cells Identified by Study DNA Mutation Rates Raise Curtain on Cause of Cancer Therapy Based on Regenerative Medicine Science Regenerative Medicine Therapy for Corneal Scarring Receives Funding Boost Moose Study Shows Implications for Understanding Arthritis in Humans Enhancing Delivery of DNA Payloads Into Cells New Delivery Device for Gene Therapy Designed Biologists Find Way to Lower Tumor Risk in Stem Cell Therapies Discovering How T Cells Make a Commitment Study Shows How Dietary Supplement May Block Cancer Cells Ronin Recruits Protein Allies to Sustain Embryonic Stem Cell Growth Brain Scans Support Genes' Role in Alzheimer's Disease Researchers Create Self-Assembling Nanodevices That Move and Change Shape on Demand Regenerative Medicine Medical Device Research Receives Year 3 Funding Scientists Reprogram Triple-Negative Breast Cancer Cells to Respond to Tamoxifen UVA Radiation Damages DNA in Human Melanocyte Skin Cells, Causing Mutations That Can Lead to Melanoma Living, Breathing Human Lung-on-a-Chip: A Potential Drug-Testing Alternative Gut Bacteria Could Be Key Indicator of Colon Cancer Risk Genetic Septet in Control of Blood Platelet Clotting Studying Cells in 3-D Could Reveal New Cancer Targets Scientists Capture Structure of Virus Changing During Infection Control of Cancer Cell Pathways Key to Halting Disease Spread, Study Shows Using Adult Stem Cells for Regenerative Medicine Therapies Gestational Diabetes Linked to Serotonin and Dietary Protein Same Types of Cell Respond Differently to Stimulus, Study Shows Technique Enables Precise Control of Protein Activity in Living Cells Using Nanotechnology to Improve a Cancer Treatment Virus Works With Gene to Cause Crohn's-Like Illness Yale Scientists Implant Regenerated Lung Tissue in Rats Researcher Explains How Embryo Fights Retroviral Infection Language of RNA Decoded: Study Reveals New Function for Pseudogenes and Noncoding RNAs Drug Mitigates Toxic Effects of Radiation in Mice New Method of Peptide Synthesis Makes it Easier to Create Drugs Based on Natural Compounds Gene Therapy Reverses Type 1 Diabetes in Mice Researchers Identify Key Enzyme in Melanoma Cell Development Molecular Discovery Suggests New Strategy to Fight Cancer Drug Resistance Defects in Immune System Enzyme May Increase Risk of Autoimmune Disorders Mutations in Presenilin Gene Cause Early-Onset Alzheimer's Disease Ironing Out Inflammation Mount Sinai Researchers Approaching Universal Treatment for All Strains of Influenza Colonies of Biomimetic Microcapsules Designed PerMMA Named a Most Promising Robot Gene Therapy for AIDS-Related Lymphoma Shows Promising Results Against Cancer, HIV Infection Researchers Discover Mechanism that Limits Scar Formation Coulter Translational Research Awardees Announced Research Team Regenerates Fully Functioning Lung Tissue in a Rat Model Gamma Interferon a Wake-up Call for Stem Cell Response to Infection Researchers Find Way to Prevent Blindness in Research Model for Retinitis Pigmentosa Stem Cells for First Time Used to Create Abnormal Heart Cells for Study of Heart Condition New Autism Susceptibility Genes Identified New Type of Human Stem Cell May Be More Easy to Manipulate Scripps Research Scientists Find New Way to Attack Cancerous Cells New Treatment Method Safe, Effective for Advanced Melanoma Patients Green Tea Extract Appears to Keep Cancer in Check in Majority of CLL Patients Gene Related to Aging Plays Role in Stem Cell Differentiation Study of MicroRNA Helps Scientists Unlock Secrets of Immune Cells Faulty Gene Stops Cell Antennae From Transmitting Binge Drinking Adolescent Monkeys' Brains Seriously Damaged by Alcohol Stem Cell Researchers Uncover Previously Unknown Patterns in DNA Methylation Bone Drug Suppresses Wandering Tumor Cells in Breast Cancer Patients Immune System Helps Transplanted Stem Cells Navigate in Central Nervous System Mount Sinai Researchers Discover One Cause of Cognitive Decline in Aging Population New Technique Reliably Detects Enzyme Implicated in Cancer and Atherosclerosis New Way Created to Study Cancer Stem Cells Novel Therapeutic Approach Shows Promise Against Multiple Bacterial Pathogens Pitt Researchers Discover Gene Mutation Linked to Lymphatic Dysfunction Targeted Immunotherapy Shows Promise in Studies for Metastatic Breast, Pancreatic Cancers Piece of the Puzzle for Individualized Cancer Therapy via Gene Silencing Discovered Retina Created From Human Stem Cells Low Caveolin-1 Expression Contributes to Lung Disease? Rheumatoid Arthritis Incidence on the Rise in Women Blocking Tumor's 'Death Switch' Paradoxically Stops Tumor Growth First Common Gene Found for Congenital Heart Disease Gene Pattern May Identify Kidney Transplant Recipients Who Dont Need Life-long Anti-Rejection Drugs New Role of Molecule in the Health of Body's Back-Up Blood Circulation Inspired by a Cotton Candy Machine, Engineers Put a New Spin on Creating Tiny Nanofibers Novel RNA Interference Screening Technique Identifies Possible Path for Malignant Glioma Treatment To Attack H1N1, Other Flu Viruses, Gold Nanorods Deliver Potent Payload Rare Hybrid Cell Key to Regulating the Immune System Gene Fusions May Be the 'Smoking Gun' in Prostate Cancer Development Building Organs Block by Block: Tissue Engineers Create a New Way to Assemble Artificial Tissues Former VP Cheney Receives Heart Device That Includes McGowan Institute Technology Study: Interventions Could Help Alleviate Sepsis Racial Disparities Regenerative Medicine Product Has Potential to Help Cerebral Stroke Patients Walking for Independence Scientists Identify Mechanism T-Cells Used to Block HIV Mayo Clinic Researchers Find Gene They Believe is Key to Kidney Cancer Estrogen-Lowering Drugs Minimize Surgery in Breast Cancer Patients CA-125 Change Over Time Shows Promise as Screening Tool for Early Detection of Ovarian Cancer Aiming to Cure Deafness, Scientists First to Create Functional Inner-Ear Cells Commonly Used Seizure Drug Could Treat Severe Genetic Liver Disease Indoor Tanning to Melanoma Definitively Linked in New Study, Researchers Say First Self-Replicating Synthetic Bacterial Cell Process of Cancer Cell Self-Digestion is Target of New Cancer Therapies Low Oxygen Levels Prevent X Chromosome Inactivation in Human Embryonic Stem Cells Potential Fix for Esophageal Disorders Discovery Allows Researchers to Further Study and Characterize Cancer Stem Cells Computer Games Assist in Patient Rehabilitation Belly Fat or Hip Fat -- It Really is All in Your Genes, Says UT Southwestern Researcher Same Disease, Different Stem Cell Models UGA Discovery Holds Promise for Treatment of Diabetes and Other Debilitating Diseases Scientists Create Human Embryonic Stem Cells With Enhanced Pluripotency Biologists Link Gut Microbial Equilibrium to Inflammatory Bowel Disease New 'Suicide' Molecule Halts Rheumatoid Arthritis Efforts Toward Treating Juvenile Rheumatoid Arthritis Hepatitis B Clinical Research Network Members Address Treatment Challenges Each Melanoma Cell Capable of Cancer Stem Cell Behavior: Study How Cancer Cells Lose Their (Circadian) Rhythm Transplanted Adult Stem Cells Provide Lasting Help to Injured Hearts Endometrial Stem Cells Could Repair Brain Cells Damaged by Parkinsons Disease Common Steroid Medications Hold Promise for Tissue Repair A New Class of Anti-Inflammatory Mediators Based on Omega-3 Fatty Acids Found Research Shows Adult Stem Cells May Protect Breast Cancer Cells from Immune Responses Gene Therapy Sets Stage for New Treatments for Inherited Blindness Our Genes Can Be Set on Pause Researchers Attack Stem Cells That Cause Colon Cancer Scientists Provide Groundbreaking New Understanding of Stem Cells Regular Aerobic Exercise is Good for the Brain, Pitt Team Says Stem Cells May Repair Malformed Bone Genes Affect Smoking Behavior, Lung Cancer Risk Neural Stem Cell Transplantation Offers Hope to Children With Batten Disease Scientists Create Stem Cells From Eggs of Aging Mice Research Finds Women With Preeclampsia Have Fewer Blood Vessel Precursor Cells Regenerative Medicine Innovation Focus of Second Open Session Less Discriminating Immune Cells Help Control HIV More Antioxidant Nutritional Supplements Is Not Always Better Clues Found for How to Produce the Next Generation of Human Blood Substitute Brain Map Helps Pinpoint Epilepsy Surgical Treatment Ceramics as a Biological Molecule Delivery Agent Worm Genes KO'd Gene Silencing May Be Responsible for Induced Pluripotent Stem Cells' Limitations UCLA Engineer Invents World's Smallest, Lightest Telemedicine Microscope Nanofibers Carry Toxic Peptides into Cancer Cells Routine Breast Cancer Biopsy Might Predict Lymph Node Cancer Spread Monocyte Turnover Predicts Speed and Severity of AIDS and Onset of Brain Disease Platinum-Based Cancer Drugs Destroy Tumor Cells by Binding to DNA Strands New Class of Drug Kills Lymphoma Cells Study Links Genes to Kidney Disease Risk Antifungal Medicine Shown to Slow Tumor Growth in Mice Study Scripps Research Scientists Solve Mystery of Fragile Stem Cells Genes Linked to Macular Degeneration Genes May Impact Vegetables Cancer Protection Benefits Tissue-Engineered Grafts Composed of Adult Stem Cells Could One Day Replace Synthetic Vascular Bypass Grafts Magnetic Attraction of Stem Cells Creates More Potent Treatment for Heart Attack Enzyme Identified That Can Attack Carbon Nanotubes For Stem Cells, Practice Makes Perfect Researchers Find a Better Way to Track Stem Cells 'Cheater' Cells May Spur Cancer Growth Some Cancer Cells Show Transient Resistance to Drugs Making the Blind See: Gene Therapy Restores Vision in Mice One Step Closer to Personalized Medicine: Researchers Find First Bio-Marker for MS USC Researchers Identify Key Mechanism That Guides Cells to Form Heart Tissue Coronary Artery Development Mystery Solved Duke Scientists Uncover Cells that Mend a Broken Heart Genes May Exert Opposite Effects in Diabetes and Inflammatory Bowel Disease 'Good' Cells Can Go 'Bad' in a 'Bad Neighborhood' Newly Identified Growth Factor Promotes Stem Cell Growth, Regeneration Chemists Influence StemCell Development with Geometry Stem Cells Used to Model Infant Birth Defect Computational Feat Speeds Finding of Genes to Milliseconds Instead of Years Golden Bullet Nanocages and Laser Light Kill Cancer Cells Promoting Healing by Keeping Skeletal Stem Cells 'Young' Insulin-Like Signal Needed to Keep Stem Cells Alive in Adult Brain Secret to Healing Chronic Wounds Might Lie in Tiny Pieces of Silent RNA What Makes Us Unique? Not Genes so Much as Surrounding Sequences Second Dose of Gene Therapy for Inherited Blindness Proves Safe in Animal Studies 60 Minutes Cameras Expose Medical Con Men Who Prey on Dying Victims Diabetes Workshops Assist Guam Community New Pulmonary Valve Replacement Therapy Procedure Performed Leptin Therapy in Animal Models Shows Promise for Type 1 Diabetes Nanoparticles Switch Off Cancer Genes in Human Tumors Scientists Demonstrate Mammalian Regeneration Through a Single Gene Deletion New Cancer Drug Screening Technique More Closely Mirrors Reality New Microscopy Technique Offers Close-Up, Real-Time View of Cellular Phenomena Human Cells Exhibit Foraging Behavior Like Bacteria Breakthrough Reveals Blood Vessel Cells Are Key to Growing Unlimited Amounts of Adult Stem Cells New Technique Allows Study of Protein Folding, Dynamics in Living Cells Key Player Found for a Cancer Typical in Down Syndrome Cells of Aggressive Leukemia Hijack Normal Protein to Grow Stem Cells Restore Sight in Mouse Model of Retinitis Pigmentosa Typhoid Fever Bacteria Collect on Gallstones to Perpetuate Disease Promising Therapy for Relapsing Multiple Sclerosis Bacteria-Killing Proteins Cover Blood Type Blind Spot Induced Neural Stem Cells: Not Quite Ready for Prime Time Secondary Stroke Prevention Needs Improvement Using Gold Nanoparticles to Hit Cancer Where it Hurts Shifting Cellular Energy Metabolism May Help Treat Cardiovascular Disease Switch That Turns on the Spread of Cancer Discovered First FDA-Approved Stem Cell Trial in Pediatric Cerebral Palsy Biologists Image Birth of Blood-Forming Stem Cells in Embryo Engineer Creates Unique Software That Predicts Stem Cell Fate Transforming Human Fat Into Stem Cells Using Virus-Free Technique Loss of Gene Function Makes Prostate Cancer Cells More Aggressive Engineers Explore Environmental Concerns of Nanotechnology Cancer Researchers Perform Complete Genomic Sequencing of Brain Cancer Cell Line Production of Stem Cells for Clinical Trials Funded by Federal Grant Key Brain Regions Talk Directly with Each Other NVWG: Not All Fun and Games Admiral Mullen, Chairman of the Joint Chiefs of Staff, Visits McGowan Institute for Regenerative Medicine Persuading Joints to Fix Themselves A Regenerative Medicine Alternative Approach to Liver Transplantation Study: Kidney Injury Linked to Greater Risk of Death Among Pneumonia Patients Efforts to Identify Circulatory Shock First Measurement of Energy Released From a Virus During Infection Scientists ID a Protein that Splices and Dices Genes Low Production of Serotonin in the Brainstem a Likely Cause for SIDS Stem Cell Breakthrough: Bone Marrow Cells Are the Answer Leukemia Cells Metabolize Fat to Avoid Cell Death Researchers Directly Turn Mouse Skin Cells Into Neurons, Skipping IPS Stage Disarming Specialized Stem Cells Might Combat Deadly Ovarian Cancer Researchers Trace Effects of Genetic Defect in Myotonic Muscular Dystrophy Groundbreaking Research Shows Platelets Can Reproduce in Circulation Genes Found Linked to Breast Cancer Drug Resistance Could Guide Future Treatment Choices Chronic Morphine Use Delays Wound Healing Potential Way to Reverse Cancer Cell Metabolism and Tumor Growth Stress Peptide and Receptor May Have Role in Diabetes Lack of Cellular Enzyme Triggers Switch in Glucose Processing Inflammation 'On Switch' Also Serves as 'Off Switch' Compounds That Help Protect Nerve Cells Discovered by Duke Team Scientists Identify Potential New Class of Drugs to Combat Hepatitis C Cell of Origin Identified for Common Type of Breast Cancer New Insights Into Inherited Retinal Disease First Successful Use of Expanded Umbilical-Cord Blood Units to Treat Leukemia New Gene Variants Associated With Glucose, Insulin Levels, Some With Diabetes Risk Cancer Stem Cells Suppress Immune Response Against Brain Tumor New Finding in Cell Migration May Be Key to Preventing Clots, Cancer Spread Excess DNA Damage Found in Cells of Patients With Friedreich's Ataxia Mutations in Different Cells Cooperate to Set the Stage for Cancer Dual Role for Immune Cells in the Brain Gene Mutations in Patients With Becker Muscular Dystrophy Identified Drug That Modifies Gene Activity Could Help Some Older Leukemia Patients Delivering Stem Cells Improves Repair of Major Bone Injuries in Rats, Study Shows Blocking Nuclear Receptor May Cut Off Tumor Blood Supply Molecular Security System That Protects Cells From Potentially Harmful DNA Discovered Sleeping Beauty Hooks up With Herpes to Fight Brain Disease Alzheimer's Discovery Could Lead to Long-Sought Preventive Treatment Biologists Develop Efficient Genetic Modification of Human Embryonic Stem Cells Eavesdropping on Bacterial Conversations May Improve Chronic Wound Healing H1N1 Virus Spreads Easily by Plane New Brain Scan Better Detects Earliest Signs of Alzheimer's Disease in Healthy People Stomach-Cancer Bug Linked to Cancer-Promoting Factor Silencing Brain Cells With Yellow and Blue Light Study Identifies a Protein Complex Possibly Crucial for Triggering Embryo Development Cancer Cells Co-Opt Fat Metabolism Pathway to Become More Malignant Epigenetics: Protein Linked to Leukemia 'Bookmarks' Highly Active Genes During Cell Division Celebrex Inhibits Burden of Skin Cancer in High-Risk Patients, Research Finds New ALS Drug Slips Through Telling Phase II Clinical Trials New Key Factor Identified in the Development of Alzheimer's Disease Protein Central to Being Male Plays Key Role in Wound Healing Smoking Cessation Linked to Diabetes, Quitters Should Watch Weight Blocking Inflammation Receptor Kills Breast Cancer Stem Cells, Study Finds Scientists Develop Technique to Determine Ethnic Origin of Stem Cell Lines New Research Could Advance Research Field Critical to Personalized Medicine Gene Therapy Makes Mice Breath Easier: Preventing Progression of Emphysema Living-Donor Liver Transplantation Study on Hospital End-of-Life Care Treatment Styles Pittsburgh Protocol Used Third Time in Nations Second Bilateral Hand Transplant Microcephaly Genes Associated with Human Brain Size New RNA Interference Technique Can Silence up to Five Genes Neuroscientists Store Information in Isolated Brain Tissue Divide and Conquer: Splitting Fluorescent Protein Helps Image Clusters in Live Cells Stanford Scientists Identify Protein That Keeps Stem Cells Poised for Action 'Self-Seeding' of Cancer Cells May Play a Critical Role in Tumor Progression Study Blames Two Genes for Aggressive Brain Cancer One Step Closer to Closure: Neuroscientists Discover Key to Spinal Cord Defects Researchers Discover Gene Therapy to Prevent Progression of Emphysema Chicago Cancer Genome Project Studies Genetics of 1,000 Tumors Novel Nanotechnology Heals Abscesses Caused by Resistant Staph Bacteria Yale Study Finds Treatment with Anabolic Hormone May Enhance Local Bone Regeneration Faster, Cheaper DNA Sequencing Method Devised Protein Link may be Key to New Treatment for Aggressive Brain Tumor Bioengineered Materials Promote the Growth of Functional Vasculature Protein that Represses Genes May Play Role in Cell Growth Caregivers of ICU Survivors are Collateral Damage of Critical Illness Pain Pumps and Chondrolysis Development of Heart Assist Device for Infants and Toddlers Gets $5.6 Million Boost Joblessness Can Lead to Depression Fat Cells for Soft Tissue Reconstruction McGowan Institute for Regenerative Medicine Design Technology Receives FDA Approval Investigational Study Focuses on Surgical Treatment for Depression Human Protein Helps Prevent Infection by H1N1 Influenza and Other Viruses Hundreds of Leads Generated in Fight Against H1N1 Pandemic Bacteria Provide New Insights Into Human Decision Making Marking Tissue-Specific Genes in Embryonic Stem Cells Crucial to Ensure Proper Function Heart Cells on Lab Chip Display 'Nanosense' That Guides Behavior Accelerated Aging: Researchers Identify Traits of People With Rare Syndrome Researchers Launch Phase II Trial of Stem Cells and Acute Heart Attack Human Umbilical Stem Cells Cleared Mice's Cloudy Eyes Small Addition to Cancer Drug May Make Big Difference Gene Therapy and Stem Cells Save Limb Spices Halt Growth of Breast Stem Cells, Study Finds Supportive Materials to Help Regenerate Heart Tissue Stem Cells Battle for Space Cholesterol-Lowering Drugs Also May Protect Stem Cell Transplant Patients from Graft-Versus-Host Disease Researchers Restore Some Function to Cells from Cystic Fibrosis Patients Strategies to Protect New Brain Cells Against Alzheimer's Disease Understanding DNA Repair and Cancer Brain Tumor Cells Made More Responsive to Radiation Green Tea Chemical Combined With Another May Hold Promise for Treatment of Brain Disorders Heart Failure Linked to Gene Variant Affecting Vitamin D Activation Cancer Cells Tricked Into Responding to New Treatments and Undergoing Cell Suicide Good Stress Response Enhances Recovery From Surgery, Study Shows New Tool in Fight Against Autoimmune Diseases, Blood Cancers Dr. Philip LeDuc Discovers New Protein Function That Could Save Lives Transplant Experts Guide Patients to New Lives as Organ Recipients Surgical Tool Successfully Performs Without Incisions 10,000th Time New Mechanism of Blocking HIV-1 From Entering Cells Identified Scientists Rescue Visual Function in Rats Using Induced Pluripotent Stem Cells Adult Stem Cells May Help Repair Hearts Damaged by Heart Attack, Study Suggests Glial Cells Can Cross from the Central to the Peripheral Nervous System Knockouts in Human Cells Point to Pathogenic Targets Implant-Based Cancer Vaccine Is First to Eliminate Tumors in Mice Cells Defend Themselves From Viruses, Bacteria With Armor of Protein Errors New Research Shows Versatility of Amniotic Fluid Stem Cells Engineer Designs Micro-Endoscope to Seek out Early Signs of Cancer Umbilical Cord Stem Cells May One Day Treat Muscle and Bone Disorders Pediatric Heart PatientOne Year Later Wheelchair Breakdowns Negatively Impact Users Health and Quality of Life Help For a Compromised Colon VAD Helps Resting Heart Regenerate When Is a Stem Cell Really a Stem Cell? Gene Mismatch Influences Success of Bone Marrow Transplants Sugar-Coated Polymer Is New Weapon Against Allergies and Asthma Beyond Genomics, Biologists and Engineers Decode the Next Frontier 'Fly Paper' Created to Capture Circulating Cancer Cells World's First Delivery of Intra-Arterial Avastin Directly Into Brain Tumor Nanotechnology Team Discovers How to Capture Tumor Cells in Bloodstream On Your Last Nerve: Researchers Advance Understanding of Stem Cells Your Own Stem Cells Can Treat Heart Disease, Study Suggests Cancers' Sweet Tooth May Be Weakness Investigating Muscle Repair, Scientists Follow Their Noses Very Young People with Very Old Knees Sorting Through Traumatic Brain Injury CBS 60 Minutes Features McGowan Institute Research and Clinical Progress VAD Technology Gives Patients Renewed Hope Working the Gray Area Between Sickness and Health Targeting 'Normal' Cells in Tumors Slows Growth, Researchers Show Largest Gene Study of Childhood Inflammatory Bowel Disease Identifies Five New Genes Unravelling the Pathology of Dementia Stem Cells Restore Cognitive Abilities Impaired by Brain Tumor Treatment Neural Stem Cells in Mice Affected by Gene Associated With Longevity Nano-Scale Drug Delivery Developed for Chemotherapy New Surgery for Heartburn A Step Closer to Reversing Type 1 Diabetes CATER Receives Renewal Funding for 5 Years McGowan Institute Researchers Partner With Levitronix Team Works to Assess Regeneration of Limbs and Digits Winning Poster Named at Biotech 2009 Scientists Guide Immune Cells With Light and Microparticles Stem Cells: Scientists Successfully Reprogram Blood Cells Some Malignant Tumors Can Be Shut Down After All Scientists Visualize How Bacteria Talk to One Another Embryonic Stem Cell Therapy Restores Walking Ability in Rats With Neck Injuries Nanomedicine Promising for Treating Spinal Cord Injuries, Findings Show New Synthetic Molecules Trigger Immune Response to HIV and Prostate Cancer Stem Cell Therapy May Offer Hope for Acute Lung Injury Alcohol Activates Cellular Changes That Make Tumor Cells Spread Scientists Show How Tiny Cells Deliver Big Sound in Cochlea Bench to Bassinet: New Insights into the Development of the Human Cardiovascular System State of the Science Workshop: Regenerative Rehabilitation Intervals Between Lung Cancer Diagnosis and Treatment Display a Health Care Disparity Helper T Cell's Effect Raises Possibility of Cellular Therapy, Vaccine Development Dendritic Cells Spark Smoldering Inflammation in Smokers' Lungs New 'Schizophrenia Gene' Prompts Researchers to Test Potential Drug Target Master Regulator Found for Regenerating Nerve Fibers in Live Animals Gene Therapy Restores Sight to Children with Congenital Blindness Manipulating Brain Inflammation May Help Clear Brain of Amyloid Plaques Study Shows How Normal Cells Influence Tumor Growth Pitt/NIH Team Finds Way to Protect Healthy Cells from Dangerous Radiation Exposure Engineered Proteins Restore Light Sensitivity to Animals Transplanted Tissue Improves Vision New Method to Coax Retinal Cells from Stem Cells Bionic Eye May Help the Blind to See Diagnosis Emerges From Complete Sequencing of Patient's Genes Detecting the Undetectable in Prostate Cancer Testing Small Mechanical Forces Have Big Impact on Embryonic Stem Cells Major Step in Making Better Stem Cells From Adult Tissue From Stem Cells to Functioning Strip of Heart Muscle Stem Cells Offer New Hope for Kidney Disease Patients Researchers Uncover Process that Determines the Fate of White Blood Cells Skin Cells May Provide Early Warning for Cancer Risk Elsewhere in Body Tissue Engineering Could Improve Hand Use for Wounded Soldiers Patients Own Stem Cells Used to Grow Facial Bone Researchers Pave the Way for Effective Liver Treatments High-Sensitivity Bone Marrow Aspiration Technology Enhances Leukemia Cell Detection 'Treason' by Immune System Cells Aids Growth of Multiple Myeloma Gene Controlling Number of Brain Cells Pinpointed Lung Cancer Risk Increases With Expression of Specific Genes 'Natural Killer' Cells Keep Immune System in Balance Scientists Discover Clues to What Makes Human Muscle Age First Patient Enrolled in TACT European Clinical Trial Salk Researchers Map the First Complete Human Epigenome Triggers Found in Cells Transition from Colitis to Cancer How Stem Cells Yield Functional Regions in "Gray Matter" Major Improvements Made in Engineering Heart Repair Patches From Stem Cells ALS May Involve a Form of Sudden, Rapid Aging of the Immune System Strategy for Mismatched Stem Cell Transplants Triggers Protection Against GVHD Healing Badly Damaged Lungs New Genetic Link Between Cardiac Arrhythmias and Thyroid Dysfunction Identified Phase III Study: Fat Absorption in Adults With Exocrine Pancreatic Insufficiency Significantly Improves Novel Surgical Adhesive Begins Clinical Trials in Germany Dr. Charleen Chu Receives Grant from the Ellison Medical Foundation Stem Cell Success Points to Way to Regenerate Parathyroid Glands Math Used as a Tool to Heal Toughest of Wounds Human Induced Pluripotent Stem Cells Retain Some Gene Expression of Donor Cells Researchers Isolate Liver Cancer Stem Cells Prior to Tumor Formation Individual Genetic Data Illuminates How Genes Influence Human Health Guide on Lung Cancer in 'Never-Smokers': A Different Disease and Different Treatments Evaluating Health and Environmental Risks From Nanotechnology: When Nano May Not Be Nano Link Between Protein and Lung Disease Found Regenerative Medicine Research Programs Receive Funding Boost and Accolades Intestinal and Multivisceral Transplant Survival Rates Improve Using Novel Treatment Scientists Identify Genes Linked to Lou Gehrig's Disease Genetic Cause for Type of Deafness Identified Protein Believed to Protect Against Cancer Has a Mr. Hyde Side Injectable Biomaterial Regenerates Brain Tissue in Traumatic Injuries Researchers Examine Mechanisms that Help Cancer Cells Proliferate Clinical Trials to Begin on Respiratory Support Medical Device The Secrets of the Lowly Ground Beetle Could Lead to Better Tissue Engineering New Type of Adult Stem Cells Found in Prostate May Be Involved in Cancer Development Overexpressed Protein Converts Noninvasive Breast Cancer into Invasive Disease Two Proteins Enable Skin Cells to Regenerate New Switch that Causes the Body to Produce Cancerous Cells Discovered Promise of Nanodiamonds for Safer Gene Therapy Engineered Protein-Like Molecule Protects Cells Against HIV Infection Variation in Prostate Stem Cell Antigen Gene Raises Bladder Cancer Risk Scientists Construct 'Off Switch' for Parkinson Therapy Immune System's Role in Bone Loss Uncovered Some Brain Tumors May be Mediated by Tiny Filament on Cells Combined Transplant-Vaccine Therapy for High-Risk Leukemia Shows Promise Retina Cells Created From Skin-Derived Stem Cells The Ends of MRNAs May Prevent the Beginnings of Cancer Regenerative Medicine Featured on Popular Sciences Premier Show Wheelchairs Robotic Arms Controlled Remotely via the Internet Dr. Eric Lagasse Receives 2009 NIH Director's Transformative R01 Award Alternative Cells for Regenerative Medicine Common Variation in Gene Linked to Structural Changes in the Brain Gene Vital to Brains Stem Cells Implicated in Deadly Brain Cancer Superglue from the Sea The Exome Project: New Strategy For Finding Disease Genes Help For Those With Leber Congenital Amaurosis Network of Microchannels Could Advance the Field of Tissue Engineering Scientists Control Living Cells With Light Gene Therapy Trial Succeeds in Boosting Protective Protein in Patients with Hereditary Lung Disease Key to Strengthening Immune Response to Chronic Infection Found Protein That May Be 'Boon' to Medicine Isolated New Method to Selectively Kill Metastatic Melanoma Cells Identified Disparities in Evaluation for Liver Transplantation Noted Multiple Types of White Blood Cells Made Directly From Embryonic and Adult Stem Cells Metastatic Cancer and Macrophages: Cells Thought to Protect Against Cancer May Actually Promote It STAT3 Gene Regulates Cancer Stem Cells in Brain Cancer Scientists Find Cells Responsible for Bladder Cancer's Spread What Makes Stem Cells Tick? Common Trigger in Cancer and Normal Stem Cell Reproduction Found Abnormal Brain Circuits May Prevent Movement Disorder Novel Tumor Suppressor Discovered Nanoparticles Target Ovarian Cancer Developing Gene Therapy to Fight Blindness Researchers Rapidly Turn Bacteria into Biotech Factories Changes in Protein Shape Could Lead to New Drugs Genes Key to Staph Disease Severity, Drug Resistance Found Hitchhiking Together Spleen Cells May Be Essential in Healing Heart Attack Damage, Mouse Study Indicates Scientists Program Blood Stem Cells to Become Vision Cells Reprogramming Human Cells Without Inserting Genes Targeted Therapy Delivers Chemo Directly to Ovarian Cancer Cells Cancer Vaccines Led to Long-Term Survival for Patients with Metastatic Melanoma MEK4, Genistein, and Invasion of Human Prostate Cancer Cells Nanodiamonds Deliver Insulin for Wound Healing Molecule Plays Early Role in Nonsmoking Lung Cancer How the Pathology of Parkinson's Disease Spreads Iron-Binding Drug Could Help Diabetics Heal Stubborn Wounds Vision: New Type of Cell That Can Sense Light Found in Fish Protein that Promotes Cancer Cell Growth Identified Update of Clinical Experiences in the Artificial Heart Program New Bone Tissue Engineering Program in Italy Robotic Systems Help People With Disabilities ISSCR Award Highlights Achievements of an Early-Career Scientist Male Germ Cells Can Be Directly Converted into Other Cell Types Bcl6 Gene Sculpts Helper T Cell to Boost Antibody Production Neural Stem Cells May Rescue Memory in Advanced Alzheimer's, Mouse Study Suggests Starve a Fever, Feed a Cold, Don't Be Stressed New Information About DNA Repair Mechanism Could Lead to Better Cancer Drugs How Staph Infections Alter Immune System BrainPort Vision Device Newly Discovered Gene Fusion May Lead to Improved Prostate Cancer Diagnosis Stripping Leukemia-Initiating Cells of Their 'Invisibility Cloak' Bone from Blood: Circulating Cells Form Bone Outside the Normal Skeleton Genes Linked to Chemoresistance Identified DNA-Damaged Cells Communicate Trouble Network of Altered Genes Appear to Play Role in Development of Brain Tumors First Successful Medical Treatment for Tumor-Inducing Genetic Disorder 'Normal' Cells Far From Cancer Give Nanosignals of Trouble How Immune Cells May Help Predict Alzheimer's Risk Key to Maintaining Embryonic Stem Cells in Lab Newborn Brain Cells Improve Our Ability to Navigate Our Environment Stem Cells' 'Suspended' State Preserved by Key Step, Scientists Report Key Protein Can Help Cells or Cause Cancer Interferon Alpha Can Delay Full Onset of Type I Diabetes, Phase II Trial Suggests Biomarker that Safely Monitors Tumor Response to New Brain Cancer Treatment First Paired Kidney Donation Involving a Pediatric Patient Performed Enzyme Identified That May Hold Key to a Long, Healthy Life Dr. Stephen Strom Named President-Elect of the Cell Transplantation Society Study Addresses a Dilemma in Idiopathic Pulmonary Fibrosis Care Wake Forest Vascular Surgeon and Tissue Engineer Moves to McGowan Institute Curb a Cancer's Deadliness? Potent Metastasis Inhibitor Identified Fate in Fly Sensory Organ Precursor Cells Could Explain Human Immune Disorder Tumor-Suppressor Recruits Help to Overcome a Barrier and Fix Cancer-Causing Defects Is Nanotechnology Safe? Interactions Between Nanomaterials and Biological Systems Explored Genes Edited in Human Stem Cells Key Found to How Tumor Cells Invade the Brain in Childhood Cancer Cancer Researchers Develop Model That May Help Identify Lung Cancer Stem Cells Protein Regulates Movement of Mitochondria in Brain Cells Better Understanding of the Developing Heart DNA Mutation that Occurs at Beginning Point of T-cell Lymphoma Identified Novel Mechanism Controlling Tumor Growth in the Brain Uncovered Breakthrough in Development of Tiny Biological Fuel Cells DNA Template Could Explain Evolutionary Shifts New Method Separates Cancer Cells from Normal Cells Major Breakthrough in Macular Degeneration Key Gene in Deadly Inflammatory Breast Cancer Identified Father's Sperm Delivers Much More Complex Material Than Previously Thought RNA Snippet Suppresses Spread of Aggressive Breast Cancer MicroRNA Replacement Therapy May Stop Cancer in Its Tracks Gene Therapy Technique Thwarts Cancer by Cutting Off Tumor Blood Supply Donor Stem Cell Transplantation Associated with Survival Benefit for Patients with Leukemia New Risk Factor Gene for Rheumatoid Arthritis Identified Gene Activity Reveals Dynamic Stroma Microenvironment in Prostate Cancer Gene Therapy for Hemophilia A Mice Link Unraveled Between Chromosomal Instability and Centrosome Defects in Cancer Cells Lethal Cancer Knocked Down by One-Two Drug Punch New Lead for Autoimmune Disease from Chinese Medicine HERL Named Center of Excellence for Wheelchairs and Associated Rehabilitation Engineering New Diabetes-Suppressive Cell Vaccine in Local Trial Diagnosing Barretts Esophagus Sleuths Follow Lung Stem Cells for Generations to Shed Light on Healing Key Regulator of Fat Cell Development Discovered 'Death Receptors' Designed to Kill Our Cells May Make Them Stronger Most Common Brain Cancer May Originate in Neural Stem Cells Combined Stem Cell-Gene Therapy Approach Cures Human Genetic Disease in Vitro New Device Detects Heart Disease Using Less Than One Drop of Blood Eight Newly Identified Genes Help Predict a Melanoma Patient's Response to Treatment First Heart Patients Implanted with Next-Generation Mechanical Heart Pump Genetic Profiling Reveals Genes Active in the Earliest Brain Circuit Construction Immunologists Identify Biochemical Signals that Help Immune Cells Remember How to Fight Infection New Therapy Substitutes Missing Protein in Those with Muscular Dystrophy Future of Personalized Cancer Treatment: New System Delivers RNA into Cells Immunotherapy Effective Against Neuroblastoma in Children Mathematical Model Developed to Predict Immune Response to Influenza Embryo's Heartbeat Drives Blood Stem Cell Formation MIT's Implantable Device Offers Continuous Cancer Monitoring Enriched Environment Improves Wound Healing in Rats Brain Chemical Reduces Anxiety, Increases Survival of New Cells Immune Cells Hold Back Gene Therapy Gift Will Support Regenerative Medicine Efforts to Cure Blindness and Vision Impairment Fat Precursor Cells May Improve Nerve Regeneration and Functional Recovery Minimally Invasive Surgery for Esophageal Cancer Major New Treatment Target in Diseased Arteries Impaired Brain Plasticity Linked to Angelman Syndrome Learning Deficits Stem Cells for the Damaged Heart: Key Factors in Heart Cell Creation Identified Stem Cells from Fat Tissue Offer Hope for MS Treatment Blood Cells Can Be Reprogrammed to Act as Embryonic Stem Cells The World of Regenerative Medicine McGowan Institute Medical Devices Laboratory a Partner to Improve Stored Red Blood Supply Enzyme on White Blood Cell Surface Reduces Tissue Damage in Stroke Genes Found to Play Role in Breast Cancer's Spread to Brain Nanotechnology Holds Promise for STD Drug Delivery Process Controlling T-Cell Growth and Production Identified What Regulates MicroRNAs?: When Cells Reach Out and Touch Tiny Differences in Our Genes Help Shed Light on the Big Picture of Human History First Large-Scale Computer Simulation of Gene Therapy World's Fastest Camera Relies on Entirely New Type of Imaging Heart Disease Expert Dr. Cecilia Lo Joins the University of Pittsburgh Welcome to Regenerative Medicine Expert Dr. Rocky Tuan Corneal Stem Cell-Based Therapies May Effectively Treat Human Blindness/Vision Impairment Brain Works Best When Cells Keep Right Rhythms, New Studies Suggest New Method Developed by Bioengineers Gives Regenerative Medicine a Boost Gene Therapy Offers New Hope for Treatment of Neurodegenerative Disorder Researchers Use Brain Interface to Post to Twitter New Way to Distinguish Cancerous from Normal Cells Computational Model Examines the Pathways of Alzheimer's that Strikes at the Young Gene Therapy for Muscular Dystrophy Shows Promise Beyond Safety Stroke Patient's Own Stem Cells Used in Trial for First Time New Alternative to Biopsy Detects Subtle Changes in Cancer Cells, Study Shows Stem Cell Marker for Possible Root of Colon Cancer Identified Researchers Develop New Way to See Single RNA Molecules Inside Living Cells New Technique Invented to Reveal Pancreatic Stem Cells Clinical Trial for GERD Treatment Device Regenerative Medicine Help for Soldiers Development Continues on Next Generation of Pediatric Heart Devices Creating Ideal Neural Cells for Clinical Use Molecule Prompts Damaged Heart Cells to Repair Themselves After a Heart Attack Key Gene That Protects Against Leukemia Identified Gene Therapy Appears Safe to Regenerate Gum Tissue Epigenetic Mark Guides Stem Cells Toward Their Destiny What's Driving Specific Patterns of Gene Expression Among Cell Types? Lab-on-a-Chip Homes In on How Cancer Cells Break Free New Protein Important in Breast Cancer Gene's Role in DNA Repair Identified Frankincense Oil -- A Wise Man's Remedy for Bladder Cancer Stem Cells Crucial to Diabetes Cure in Mice Gene Therapy Shows Early Promise for Treating Obesity Gender May Determine Death in Seniors Following Pneumonia Successful Hand Transplants Performed Depression Drug Clinical Study Participants Do Not Reflect Actual Patient Population McGowan Institute Faculty Members Named 2009 Top-Ranked Physicians Ten Genes Associated with a Risk Factor for Sudden Cardiac Death Identified Lab-Grown Nerves Promote Nerve Regeneration After Injury Human Genes Required for Hepatitis C Viral Replication Identified Potential Target for Cancer, Wound Healing, and Fibrosis Discovered New Generation Oral Vaccine Uses Dairy Probiotics to Protect Against Disease Mechanism of Alzheimer's Suggests Combination Therapy Needed Protein Helps Immune Cells to Divide and Conquer Misplaced Metamorphosis: Researchers Identify Source of Cells that Spur Aberrant Bone Growth Scientists Find Gene that Modifies Severity of Cystic Fibrosis Lung Disease Computer Models Help Illustrate How Neural Networks Function Switch May Prevent the Spread of Cancer Cells to Distant Sites in the Body Nanoprobes Help Locate Tumors New Mouse Model Helps Skin Cancer Research Efforts Specific Genes May Be Tied to Addictions Human Engineering Research Laboratories Regenerative Medicine Efforts Highlight of Radio Talk Show Gene Mutation May Cause Poor Lung Development in Children Immune Cells from Patients with RA Have Prematurely Aged Chromosomes Assembling Cells into Artificial 3-D Microtissues, Including a Tiny Gland New Type of Vaccination Provides Instant Immunity Gene Involved in Pancreatic Cancer Identified Protein Complex Shown to Play Pivotal Role in Stem Cell Development Vitamin A Signals Offer Clues to Treating Autoimmunity Stem Cell Breakthrough: New Method for Creating Stem Cells Image Pinpoints all 5 Million Atoms in Viral Coat Process for Expansion and Division of Heart Cells Identified Boosting its Infectivity Turns Benign Virus into Good Gene Therapy Carrier for Cystic Fibrosis Indicator Found that Warns Leukemia is Progressing to More Dangerous Form Dendritic Cells as New Player in Arteries and Heart Valves Could Nanotechnology Make an Average Donut into Health Food? Nanoscopic Changes to Pancreatic Cells Reveal Cancer Molecular Motors in Cells Work Together, Study Shows Device Aims to Decrease Wait Period for Patients Needing Immunotherapy New Lab Evidence Suggests Preventive Effect of Herbal Supplement in Prostate Cancer New Genomic Test Can Personalize Breast Cancer Treatment Stem Cells in Hair Follicles Point to General Model of Organ Regeneration 3-D Snapshots of Eyes May Pave the Way for New AMD Treatments Oprah Show Features Regenerative Medicine Work Successful Hand Transplant Performed New Test May Help to Ensure That Dengue Vaccines Do No Harm Targeted Immune Cells Shrink Tumors in Mice Study Suggests Possible Treatment for Neurological Disorder Rett Syndrome Heart Disease Research Uncovers New Tactic Against Fatal Muscular Dystrophy Leukemia Stem Cells Have More in Common With Embryonic Stem Cells Than Adult Stem Cells MicroRNA Plays a Key Role in Melanoma Metastasis Source of Cancer Stem Cells' Resistance to Radiation Discovered Researchers Find Master Gene Behind Blood Vessel Development New Clues to Pancreatic Cells' Destruction in Diabetes Super-Resolution Microscopy Takes on a Third Dimension Cell-Building Discovery Could Reduce Need for Some Animal Research Study: Tracking Range of Motion Post Surgery Minimally Invasive Surgery Options for Treatment of Glaucoma Now Available General Mills Features Athletes on Cheerios Box in Support of the National Veterans Wheelchair Games Bridging the Gap Between Cancer Research and Foods People Eat Stat3 Signaling Tips the Balance of Immunity in Favor of Cancer Link Found Between Parkinson's Disease Genes and Manganese Poisoning New Class of Non-Protein Coding Genes in Mammals with Key Functions Uncovered Pancreatic Tumor Growth Prevented in Mice by Inhibiting Key Protein Stem Cell Transplant Reverses Early-Stage Multiple Sclerosis Physics, Math Provide Clues to Unraveling Cancer 'Healthy' Obesity May Be Explained by Newly Identified Protein Genes Linked to Parkinson's Side Effects Identified Worm Provides Clues About Preventing Damage Caused by Low-Oxygen During Stroke, Heart Attack St. Jude Finds More Than 100 Gene Variations Linked with Response to Leukemia Treatment Scientists See Progress in FDA Stem Cell Trial Approval The Genes in Your Congeniality Fluorescent Proteins Illuminating Biomedical Research Brain's Memory 'Buffer' Discovered in Single Cells Implants Mimic Infection to Rally Immune System Against Tumors Immune System: Decoding the Language of Memory Cells How Chemotherapy Drugs Block Blood Vessel Growth, Slow Cancer Spread Hope for Restoring Injured Nerves New Method Prevents MicroRNAs from Escaping Cells Cell Transplantation and Diabetes: New Sites, New Devices Engineered Virus Targets and Kills Apparent Cancer Stem Cells in Neuroblastoma Altered Brain Activity in Schizophrenia May Direct Focus on Self Gene Switch Sites Found Mainly on 'Shores,' Not Just 'Islands' of the Human Genome Easy Assembly of Electronic Biological Chips How Aging Undermines Bone Healing Abnormal DNA Repair Genes May Predict Pancreatic Cancer Risk Gene Therapy Eliminates Brain Tumors Through Selective Recruitment of Immune Cells Novel Technique Changes Lymph Node Biopsy, Reduces Radiation Exposure in Breast Cancer Patients Wireless Microgrippers Grab Living Cells in 'Biopsy' Tests Protein's Essential Role in Repairing Damaged Cells Revealed Model Predicts How to Build a Better Stent Newly Discovered Esophagus Stem Cells Grow into Transplantable Tissue Emerging Technology--Miniaturized Heart Pumps for Children Regrowing Teeth HeartLander: Surgical Robot Sets Down on the Heart Dr. Savio Woo Receives Honorary Degree of Doctor of Engineering from The Hong Kong Polytechnic University Regenerative Medicine Approach May One Day Reconstruct Breasts Following Mastectomy Dr. Ronald Herberman Leaves Significant Mark at University of Pittsburgh Cancer Institute Dr. Steven Belle Awarded $11 Million Grant to Coordinate the Hepatitis B Clinical Research Network Reminders for Protecting Your Hearing and Your Voice Protein that Amplifies Cell Death Discovered: Potential New Way to Kill Cancer Cells Diabetes: Human Beta Cells Can Be Easily Induced to Replicate Gene Abnormality Found to Predict Childhood Leukemia Relapse Bioreactors Might Solve Blood-Platelet Supply Problems Patient-Derived Induced Stem Cells Retain Disease Traits Dr. Ellen Gawalt Receives National Institute of Arthritis and Musculoskeletal and Skin Diseases Grant Clinical Trial: Gene Therapy Reduces Symptoms in Patients with Rheumatoid Arthritis Gender Determines Brain Cells Ability to Survive Starvation Scientists Discover New Mechanism Behind Aging in Mice New Technology for Detecting Gene Fusions Opens Field in Cancer Research Disabling Enzyme Allows Mice to Gorge Without Becoming Obese Gene Marker May Improve Odds of Stem Cell Therapies for Disease Molecular Origin of Blood Stem Cells Unlocked Nose-Spray Vaccine Against Botulism Effective in First Tests Converting Adult Somatic Cells to Pluripotent Stem Cells Using a Single Virus Growth of New Brain Cells Requires 'Epigenetic' Switch Absence of CLP Protein Can Be Indicative of Oral Cancer 'Scrawny' Gene Keeps Stem Cells Healthy Study Yields Clues about the Evolution of Epilepsy Nerve Cells in the Brain and Spinal Cord Sense Pain Caused by Physical Insult Testes Stem Cells Can Change into Other Body Tissues 'Relocation' Plan of Metastatic Cancer Cells Uncovered Novel Glioblastoma Mouse Model Developed Breast Cancer Gene Linked to Disease Spread Discovered New Hope for Cancer Cure Comes Straight From the Heart Fusing Embryonic Stem Cells with Adult Cells Using Highly Efficient New Fusing System New Genetic Markers for Ulcerative Colitis Identified Lung Cancer Cells Activate Inflammation to Induce Metastasis New Findings on Alzheimers Disease Why Prostate Cancer Patients Fail Hormone Deprivation Therapy Dormant Cancer Cells Rely on Cellular Self-Cannibalization to Survive Blood Sugar Linked to Normal Cognitive Aging Gene Therapy Reversed Heart Damage in Heart Failure Gene Expression and Splicing Vary Widely from One Tissue to the Next Groundbreaking, Inexpensive, Pocket-sized Ultrasound Device Can Help Treat Cancer, Relieve Arthritis New Label-free Method Tracks Molecules and Drugs in Live Cells Mouse Studies Show Gene Therapy Method Holds Promise in Targeting Tumor Blood Vessels for Destruction Genes Involved in Antibiotic Resistance Vary Within a Species Researchers Provide Definitive Proof of Where, How Blood Stem Cells Are Created Dr. Lee Named Co-Investigator in C-PORT Cardiovascular Clinical Trial U.S. Army Warrior Transition Unit May Be Established in Pittsburgh Biomedical Researchers Create Artificial Human Bone Marrow in a Test Tube Snails and Humans Use Same Genes to Tell Right from Left Researchers Identify Gene Linked to Inherited Form of Fatal Lung Disease Stem Cells and Leukemia Battle for Marrow Microenvironment Researchers Identify Gene Linked to Inherited Form of Fatal Lung Disease FDA Approves Drug that Boosts Stem Cell Yield for Bone Marrow Transplants Older Age Doesn't Affect Survival After Bone Marrow Transplant Novocell Announces Collaboration with World-Renowned Stem Cell Researcher Shinya Yamanaka of Kyoto University Alternative Splicing Proteins Prompt Heart Development Stem Cells Deliver Gene Therapy to Bone Tumors in Preclinical Test Nanotechnology: To Know It Is Not Necessarily To Love It Study Associates 11 New Gene Sites with Cholesterol, Triglyceride Levels Blood Scanner Detects Even Faint Indicators of Cancer Regenerative Medicine Clinical Trial: Pittsburgh Protocol for Immunosuppression After Hand Transplant Evolution of New Brain Area Enables Complex Movements Therapy Option for Short Bowel Syndrome Patients Fat Cell Therapy Benefits Mans Best Friends Dr. William Wagner Named to TERMIS North American Council Regenerative Medicine Success Story: A Tissue-Engineered Trachea Dr. Latimer Awarded Komen Breast Cancer Research Grant Molecular Marker Identifies Normal Stem Cells as Intestinal Tumor Source New Way to More Rapidly Generate Bone Tissue Developed Single Virus Used to Convert Adult Cells to Embryonic Stem Cell-like Cells Light Shines for Potential Early Cancer Diagnosis Technique Tracking the Molecular Pathway to Mixed-lineage Leukemia Nanotubes Sniff Out Cancer Agents in Living Cells Single Adult Stem Cell Can Self Renew, Repair Tissue Damage in Live Mammal Charting HIV's Rapidly Changing Journey in the Body Gene Therapy Effective Treatment Against Gum Disease Team Sheds Light on Alzheimer's Mystery Nanoparticles Delivering Drugs Can Kill Skin, Breast Cancer Cells Researcher Invents Lethal 'Lint Brush' to Capture and Kill Cancer Cells in the Bloodstream First Functional Stem-Cell Niche Model Created by Stanford Scientists Genetic Makeup May Influence Response to Alcohol Mathematical Model Gives Clearer Picture of Physics of Cells, Organelles Exploring Gene Therapy to Fight AIDS Some Blood-System Stem Cells Reproduce More Slowly Than Expected Bone Marrow-Derived Stem Cells May Offer Novel Therapeutic Option for Skin Disorder Extraordinary Immune Cells May Hold the Key to Managing HIV Understanding of Bone Marrow Stem Cell Niche Expanded Novel Human Stem Cell-based Model of Amyotrophic Lateral Sclerosis Opens Doors for Rapid Drug Screening Genetic Breakdown in Fanconi Anemia May Have Link to HPV-Associated Cancer Interferon Needed for Cells to 'Remember' How to Defeat a Virus New 'Control Knobs' for Stem Cells: Changes in Membrane Voltage Control Timing of Differentiation Scientists Probe Limits of 'Cancer Stem-Cell Model' How Ovarian Tumors Evade Immune System Scientists Track Genetic Changes in Leukemia Protein That Determines Cell Polarity Prevents Breast Cancer, Study Suggests Cell Receptor Identified as Target for Anti-inflammatory Immune Response Tiny Protein Provokes Healthy Bonding Between Cells Adult Brain Neurons Can Remodel Connections Not as Easy as it May Seem Technique to Count Messages Made by Single Genes Developed Dr. Michalopoulos Named a Fellow of the American Association for the Advancement of Science First Paired Kidney Transplant Performed New Guidelines Released for Stem Cell Research Regenerative Medicine and Trauma Care for Todays Soldiers: From Bench to Battlefield Biomimetics: A New Regenerative Medicine Approach Novel Treatment for Lung Disease Potential New Drug Target for Chronic Leukemia Identified Mammals Can Be Stimulated to Regrow Damaged Inner Retina Nerve Cells First Comprehensive Map of Genes Likely to Be Involved in Bipolar Disorder Ideal Time for Stem Cell Collection for Parkinsons Disease Therapy Defined Pluripotent Stem Cells Shown to Generate New Retinal Cells Necessary for Vision Exercise Increases Brain Growth Factor and Receptors, Prevents Stem Cell Drop in Middle Age Gore-Tex-Type Device Designed to Stop Strokes and Mini-Strokes Genes Associated With Fat Metabolism Could Increase Kidney Cancer Risk SpineSmith Partners Collaborates with University of Texas Biomedical Engineering Students to Develop Innovative Products Patient's Own Stem Cells Can Be Used to Treat Heart Failure New Clue Emerges for Cellular Damage in Huntington's Disease Tiny Sacs Released by Brain Tumor Cells Carry Information That May Guide Treatment FoxJ1 Helps Cilia Beat a Path to Asymmetry Biomedical Engineers' Detective Work Reveals Antibiotic Mechanism Protein Compels Ovarian Cancer Cells to Cannibalize Themselves 'Two-headed' Antibody Poses a Double Threat to Breast Cancer Cells Common Anesthetic Induces Alzheimers-Associated Changes in Mouse Brains Protein Can Nurture or Devastate Brain Cells, Depending on Its 'Friends' First Placenta-Derived Stem Cell Clinical Study Receives FDA Clearance Engineered Killer T-Cell Recognizes HIV-1s Lethal Molecular Disguises Researchers Aim to Over-Stress Already Taxed Mantle Cell Lymphoma Cells Studying Individual Breast Cancer Cells for Days at a Time, Using New Method Tumors Grow Faster Without Blood-Supply Promoting Molecule MP3 Headphones Interfere with Implantable Defibrillators, Pacemakers Childrens Hospital of Pittsburgh of UPMC Study Demonstrates Unique Form of Bone Marrow Transplant Can Cure Sickle Cell Disease Stem Cells from Monkey Teeth Can Stimulate Growth and Generation of Brain Cells Predictive Tests and Early Treatment Delay Progression of Blood Cell Cancer Found Anti-VEGF Drugs for Retinal Diseases Could Have Serious Side Effects Tackling a Hard-to-Treat Childhood Cancer by Targeting Epigenetic Changes Seasonal Affective Disorder May Be Linked to Genetic Mutation Dr. Michael Sacks Named 2009 Recipient of the ASME Van C. Mow Medal Injured Heart Muscle Repaired in Laboratory Tests of Novel Stem Cells Light Triggers New Code for Brain Cells Stem Cells with Potential to Regenerate Injured Liver Tissue Identified New Nanomaterial Breakthrough Grant Received to Improve Survival Rates in Patients with Heart Failure Dr. Partha Roy Named Member of International Cancer Research Project First Trial of Gene Therapy for Advanced Heart Failure Shows Promising Results Key Mechanism that Regulates Development of Stem Cells into Neurons Identified Drugs May Foil Tumors by Building up Blood Vessels, Not Tearing Them Down Scientists Identify Exciting New Compounds for Stem Cell Production from Adult Cells Dr. Philip LeDuc Invited Participant in Recent Think Tank Event New HIV Vaccine Candidate Shows Positive Results Untangling DNA Regulation: Biologists Theorize Role for DNA Packaging in Stem Cell Development Scientists Confirm a Molecular Clipping Mechanism Behind Stem Cell Development Research Sheds Light on Key Trigger of Embryonic Stem Cell Differentiation Previously Unknown Immune Cell May Help Those with Crohn's and Colitis Mouse Study: Arsenic in Drinking Water May Increase Risks For Cardiovascular Disease Human Genes: Alternative Splicing Far More Common Than Thought New Method Provides Panoramic View of Protein-RNA Interactions in Living Cells Persistent Bacterial Infection Exploits Killing Machinery of Immune Cells Mending Broken Hearts with Tissue Engineering New Microscopy Technique: High Throughput Imaging Speeds Analysis of Hormone Receptors Effects of Local Intra-Articular Anesthesia Injections on Cartilage Research Team Solves Structure of 'Beneficial' Virus Telerehabilitation Focus of Recent Virtual Conference 2008 Technology Transfer: Three Start-Up Companies from Pitt Research Efforts Scientist Clears Hurdles for Muscular Dystrophy Therapy Without Glial Cells, Animals Lose Their Senses Dr. Andrew Schwartz Featured on CBS 60 Minutes New Regulatory Mechanism Discovered for Cell Identity and Behavior in Forming Organs Simple Chemical Procedure Augments Therapeutic Potential of Stem Cells Robotic Probe Technology Headed for Clinical Surgical Use Cancer Requires Support from Immune System to Develop Gene Scan of Alzheimers Families Identifies Four New Suspect Genes Programmable Genetic Clock Made of Blinking Florescent Proteins Inside Bacteria Cells Next-Generation Topical Drug Delivery Strategy Receives Funding New Way to Attack Some Forms of Leukemia Discovered Engineering Technique to Identify Disease-Causing Genes Found Pervasive Network Driving Protein Production and Placement in Cells Discovered Healing Process Found to Backfire in Lung Patients Exploring the Use of Fat Cells as Heart Attack Therapy MicroRNAs Make for Safer Cancer Treatments Battlefield Medic on a Chip Mechanism in Cells that Generate Malignant Brain Tumors May Offer Target for Gene Therapy Mouse Prostate Grown from a Single Cell Silencing a Protein Could Kill T-Cells, Reverse Leukemia Stem Cell Research to Benefit Horse Owners and Trainers Researchers Examine Evolution of Genes that Trigger the Bodys Immune Response to Viral Infection Seemingly Suicidal Stunt is Normal Rite of Passage for Immune Cells Sugar Plays Key Role in How Cells Work Salk Researchers Successfully Reprogram Keratinocytes Attached to a Single Hair Swamping Bad Cells with Good in ALS Animal Models Helps Sustain Breathing "Plug-and-Play" Synthetic RNA Device Created New Links Between Stem Cells, Aging, and Cancer Gene Therapy Restores Vision to Mice with Retinal Degeneration Cancer Fighting Human Immune Cells to be Grown in Pigs Bugs in the Gut Trigger Production of Important Immune Cells, Study Finds Stem-Cell Sentry Sounds the Alarm to Maintain Balance Between Cancer and Aging Tumor Formation in Stem Cells Linked to Mitochondria Mouse Study Shows Fetal Heart can Grow Cells to Repair Disease Damage Landmark FSU Study Unlocks Stem Cell, DNA Secrets, Advances Therapy Stem Cells May Act as "Trojan Horse" to Deliver Gene Therapy to Injured Central Nervous System Stabilizing Force for Good Communication Between Neurons and Muscle Cells Found Time of Day Influences Yield for Pharmacologically Stimulated Stem Cell Mobilization Scientists Pinpoint Key Proteins in Blood Stem Cell Replication Scientists Identify a Molecule that Coordinates the Movement of Cells Breast Cancer Cells Recycle to Escape Death by Hormonal Therapy New Genes Linked to Gout Scientists Deliver Toxic Genes to Effectively Kill Pancreatic Cancer Cells Childrens Hospital Scientists Move to New State-of-the-Art Research Tower Laryngitis: No Laughing Matter Childrens Transplant Department Partners with The Children's Home of Pittsburgh & Lemieux Family Center Killing 'Angry' Immune Cells in Fat Could Fight Diabetes Using Living Cells as Nanotechnology Factories Fat-Regenerating Stem Cells Found in Mice Vascular Marker of Ovarian Cancer Identified Bladder Cancer Detected Via Amplified Gene in Cells Found in Urine Type 1 Diabetes May Result from Good Genes Behaving Badly Novel Anti-Cancer Mechanism Found in Long-Lived Rodents Scientists Identify Genes Capable of Regulating Stem Cell Function New Leukemia Signal Could Point Way to Better Treatment Scientists Turn Human Skin Cells into Insulin-Producing Cells Colorful Spy Tactics Track Live Cells Supporting Cancerous Tumors Stem Cells May Solve Mystery of Early Pregnancy Breast Cancer Protection Discovery Holds Hope for Muscular Dystrophy Patients Gene Therapy for Chronic Pain Gets First Test in People Adult Stem Cells Activated in Mammalian Brain Spinal Cord Stem Cells Could Be Basis of Nonsurgical Treatment for Spinal-Cord Injuries Tips on How to Build a Better Home for Biological Parts Dr. Tao Cheng Receives NIAID Grant Award Pitts School of Engineering Board of Visitors Faculty Award Winner: Dr. Anna Balazs New Hemostatic Dressings for Soldiers: Save More Lives and Money MG (Ret) Gale Pollock Named to Aetna Military Health Care Advisory Committee Chance Encounter May Lead to a Regenerative Medicine Procedure Mouse iPS Cells Created Using Harmless Adenoviruses Dr. David Perlmutter Elected to the Institute of Medicine Keeping Herpes Infection in Check Dr. LeDuc Named Russell V. Trader Career Faculty Fellow in Mechanical Engineering Zone of Resistance Gene Therapy Approach May Prevent Growth of Brain Tumor Molecules That Inhibit Important Gene Regulators Discovered Promising Results in Phase 1 Gene Therapy Trial for Leber Congenital Amaurosis Muscle-Derived Stem Cells May Improve Efficiency of Therapies and Healing Regenerative Medicine Help for Injured Soldiers Dr. Chu Named Albert B. Ferguson Jr., MD, Endowed Chair in Orthopaedic Surgery Embryonic Stem Cells Might Help Reduce Transplantation Rejection Stem Cell Regeneration Repairs Congenital Heart Defect Apples and Oranges: Tumor Blood Vessel Cells are Remarkably Atypical MIT Zooms in on Malaria-Infected Cells Berlin Heart EXCOR: Option for Children Awaiting Heart Transplant Dr. Paul Monga Named Head of Division of Experimental Pathology Artificial Heart Program Receives Highest Achievement of Quality and Compliance Dr. Barry London Receives NIH Pioneer Award Study: Post-Traumatic Stress Endures Over Time in Family Members of ICU Patients Adult Stem Cells Found in Blood Vessels with Broad Ability to Regenerate Other Tissues Cells That Mediate Steroid-Resistant Asthma Identified U.S. First: Incisionless Heartburn Surgery Cardiac Arrest: Dont Wait to Get Medical Care Nations First: Center for Ocular Regeneration and Vision Restoration Dr. Weisz Named Associate Director of the Comprehensive Kidney Research Center Safety Study Indicates Gene Therapy for Blindness Improves Vision NC State is First University in Nation to Offer Canine Bone Marrow Transplants New Methods Identify and Manipulate 'Newborn' Cells in Animal Model of Parkinson's Disease Researchers Pinpoint Geographic Origins of Individuals Using DNA New Approach, Old Drug Show Promise Against Hepatitis C More Genes Are Controlled by Biological Clocks Than Previously Thought One Cause of Higher Rates of Transplanted Kidney Rejection in Blacks Found Researchers Devise Means to Create Blood by Identifying Earliest Stem Cells Location, Location, LocationImportant For Genes, Too Researchers Create Insulin-Producing Cells from Adult Pancreatic Cells OHSU Grows Hair Cells Involved in Hearing First Gene Associated With Dry Macular Degeneration Found Black Raspberries Slow Cancer by Altering Hundreds of Genes Not All Fat is Created Equal Early Trigger Found for Type-1 Diabetes in Mice, Stanford Scientists Report Stem Cells Stand Up for Themselves Scientists Discover Leptin Can Also Aid Type 1 Diabetics Senescence in Liver Cells is Found to Help Limit Acute Tissue Damage Clinical-Scale Generation of Functional Red Blood Cells from Human Embryonic Stem Cells UCR Researcher Develops Novel Method to Grow Human Embryonic Stem Cells Study Reveals How Diet, Antioxidants Prevent Blindness in Aging Population Limbs Saved by Menstrual Blood Stem Cells Immune Response to Human Embryonic Stem Cells in Mice Suggests Human Therapy May Face Challenge Carbon Nanotubes: Targeted Delivery System Immunotherapy in High-Risk Pediatric Sarcomas Shows Promising Response Palate Formation Problems Studied Human Engineering Research Laboratories: Wheelchair Design and Use Highlighted Dr. Ira Fox, Leading Researcher in Pediatric Liver Cell Transplantation, Joins McGowan Institute Schizophrenia Treatments Research Gets Funding Boost Composite Tissue Allotransplantation: Today and the Future Making "Good" Fat from Muscle and Vice Versa Experiments Could Lead to New Treatments for Neuroblastoma Nasal Hepatitis B Vaccine Elicits Robust Immunity with a Single Dose Childhood Brain Tumor Traced to Normal Stem Cells Gone Bad Regenerative Medicine, Biomaterials, Metallurgy, and Nano- and Sensor Technology Focus of Multi-University Collaborative Effort Celebrating 10-Year Anniversary of Historic Transplant Surgery Dr. Rubin Innovates New Procedures in Body Contouring Work Bone Marrow Stem Cells May Help Control Inflammatory Bowel Disease Researchers Discover Scent of Skin Cancer Polyketals May Improve Treatment of Inflammatory Diseases Yale Researchers Discover Tiny Cellular Antennae Trigger Neural Stem Cells Study Finds Connections Between Genetics, Brain Activity, and Preference Genetic Mechanisms Linked to Parkinsons Disease Uncovered Dr. Schuman Awarded Grant from Research to Prevent Blindness Organization To Protect Against Liver Disease, Body Puts Cells 'Under Arrest' Study Implicates Gene Abnormalities in Bipolar Disorder Hydrogels for Growth of Bone Cells Developed Synthetic Molecules Could Add Spice to Fight Against Cancer Preeclampsia Study Focuses on Role of Obesity Regenerative Medicine Work to be Featured at Pop!Tech 2008 Symposium Challenged Conventional Theories About Immunology and Inflammation New John G. Rangos Sr. Research Center Set to Open in October 2008 Researchers Correct Decline in Organ Function Associated With Old Age Putting microRNAs on the Stem Cell Map Multi-Tasking Molecule Holds Key to Allergic Reactions B Cells Can Act Alone in Autoimmune Disease, Yale Researchers Report Researchers Halt Spread of HIV with RNAi Trigger for Brain Plasticity Identified Beyond PTEN: Alternate Genes Linked to Breast, Thyroid, and Kidney Cancer Predisposition 20 Disease-Specific Stem Cell Lines Created Regenerative Medicine Research to Benefit from Keck Foundation Awards Recipe for Cell Reprogramming Adds Protein UNC Study: Shape, Not Just Size, Impacts Effectiveness of Emerging Nano-Medicine Therapies Fruit-Fly Study Adds Weight to the Theories About Another Type of Adult Stem Cell Neurons Created From Skin Cells of Elderly Patients with ALS Dr. Cui Receives NSF Faculty Early Career Development Award Special Cells May Prevent Asthma and Other Allergies Study in Mice Leads to Protein Linked to Bone Marrow Failure in Humans Predicting Acute GVHD by Gene Expression Could Improve Liver Stem Cell Transplant Outcomes Blood Vessels Successfully Grown in Mice HIV Conquers Immune System Faster than Previously Realized FDA Launches New Fellowship Program How Cells Die Determines Whether Immune System Mounts Response Brain Scientists Spot Nature/Nurture Gene Link Stem Cell Researchers at UM Enrolling Patients in Heart Failure Study Vitamin A Pushes Breast Cancer to Form Blood Vessel Cells Bone Marrow-Derived Stem Cell Recovery Device Authorized for Use Charting the Molecular Landscapes Within Stem Cells Symposium Focuses on Needs of Returning US Armed Services Members Dr. Pitt Leads Summer Student Program, PITT-STEER Cell Phone Use Alert Issued by Head of University of Pittsburgh Cancer Institute A Shortcut for Communication Between Brain Cells Reducing Antibody Levels in Patients Undergoing Transplantation Smothered Genes Combine with Mutations to Yield Poor Outcome in Cancer Patients Researchers Hone Technique to KO Pediatric Brain Tumors Stem Cells Used to Treat Muscular Dystrophy in Mice Young Women's Breast Cancers Have More Aggressive Genes, Worse Prognosis Trial of Novel Treatment for Patients with Severe Crohn's Disease Pathologists Believe They Have Pinpointed Achilles Heel of HIV Genes That Control Embryonic Stem Cell Fate Identified Laser Surgery Probe Targets Individual Cancer Cells Hepatitis C Virus May Need Help of Enzyme to Cause Liver Disease Researchers Identify New Targets for RNAs That Regulate Genes Statins Have Unexpected Effect on Pool of Powerful Brain Cells Researchers Develop Tool to Study Genes Gene Directs Stem Cells to Build the Heart Smart Materials Get Smarter New Technique Produces Genetically Identical Stem Cells Salk Researchers Reprogram Adult Stem Cells in Their Natural Environment Cancer Cells Revert to Normal at Specific Signal Threshold, Stanford Researchers Find Tool to Untangle the Web of Signaling Pathways Designed Device Blocks Nerve Impulses, Helps Obese Lose Weight Scientists Closer to a Safe and Efficient Gene Delivery Method Nerve Cells Transplanted into Mice May Lead to Improved Brain Treatments Promising Therapeutic Targets for B-Cell Lymphomas Discovered Blue Light May Stunt Tumor Growth New Source of Heart Stem Cells Discovered Blocking a Single Protein Proves Toxic to Myeloma Cells in Laboratory Studies Researchers Find New Ways to Regulate Genes, Reduce Heart Damage Cloned Cells Alone Kill Tumors First Gene Therapy for Heart Failure Offered at New York-Presbyterian Hospital/Columbia University Medical Center New Cancer Treatment Targets Both Tumor Cells and Blood Vessels Patients Dependent on Ventilator Get Relief from Diaphragm Pacing System (DPS) Penn Researchers Find Key Developmental Pathway Activates Lung Stem Cells Gene Therapy Improves Survival and Quality of Life of Dogs with Cancer Mutant Mouse Mimics Human Bone Cancer Old Muscles Renewed Created Molecule Stimulates Nerve Stem Cells to Mature Into Nerve Cells Secret Ingredient: Nanoparticles Aid Bone Growth Guidelines Coming to Counter Stem Cell Snake Oil Treatment Claims Cord Blood Credited for Cure Honey and Silver Help Treat Wounds Stem Cells Support Spine Caution on Stem Cell Therapy: Single Organs May Contain Several Types of Adult Stem Cells Brain Stem Cells Can Be Awakened, Say Scientists Forum to Focus on Math and Mechanics Behind Life Processes Duke Scientists Show Why Cells Starved of Iron Burn More Sugar New Technology Enhances and Expands Homing and Therapeutic Potential of Cord Blood Stem Cells in Bone Marrow Transplants In Mice, Human Stem Cells Show Promise Against Fatal Children's Diseases Arthritis Hope: Engineers Use High Pressure to Stimulate Growth of New Cartilage Biomaterials and Tissue Engineering Approaches for Disease Research University of Minnesota Doctors Led a Team That May Have Saved Toddler With RDEB Brown Researchers Work Toward Ending Cartilage Loss Mouse Model Developed Mimics Hyperglycemia, Aids in Diabetes Research Blocking Immune System Signaling May Help Alzheimers Patients Lower Limb Ischemia Patients Experiencing Remarkable Results Gene Therapy for Head and Neck Cancer Invented Monkey Think, Monkey Do With Robotic Arm Shear Stress Improves Stem Cell Attachment to Vascular Surfaces USC Stem Cell Study Sheds New Light on Cell Mechanism Therapy Yields Promise for Fatal Neurological Condition Pancreatic Research Focus of Recent Annual Meeting Spotlight: Dr. Massimo Trucco Burn Therapy: A Regenerative Medicine Approach Filling the Shortage of Skilled Biotechnology Technicians Fabulous Fat Congratulations, Dr. Fu! Predictive Patient Safety Technology: Study Inflammatory Biomarker May Help Identify Suitable Organs for Transplant Cancer Partnership Established Medical Problems Get Mathematics Help Johns Hopkins Researchers Develop Human Stem Cell Line Containing Sickle Cell Anemia Mutation Could Baby Teeth Stem Cells Save Your Child? Weill Cornell Team Identifies New Cancer Stem Cell Driving Metastatic Tumors Researchers Identify Leukemia Stem Cells and the Alterations that Cause Stem Cells to Become Cancerous Bone Cells Found to Influence Blood Stem Cell Replication and Migration The Genetics of Fat Storage in Cells Revealed Novel Wound Dressing Receives Recognition from the Wound Healing Society Stem Cell Research Goes Beyond Biology: An Engineers Prospective UF Researchers Develop Improved Gene Therapy Agent UC Davis Children's Hospital Researchers Identify Candidate Adult Bladder Stem Cells Stem Cells Found for the First Time in the Pituitary Scottsdale Biotech Firm Helps Create Spray-on Bandage Scientists Discover a Molecular Scaffold That Guides Connections Between Brain Cells Northeastern University Researcher Proves Oral Gene Delivery System Works Gene Therapy Improves Vision in Patients with Congenital Retinal Disease Embryonic Pathway Delivers Stem Cell Traits Detecting Alzheimers Disease With a Blood Test Stem Cells Might Contribute to Vascular Disease Seroma Formation Prevented in an Animal Adominoplasty Model: Study Results Natural Killer Cells from Cord Blood Kills Leukemia Cells in Mice Misdirected Immune System Cells May Cause Type 1 Diabetes Estrogen-like Molecule May Be a Safe Alternative to HRT Pediatric Liver Transplant Patients Enjoy Good Quality of Life Years After Surgery Carbon Nanotubes May Help With Cartilage Damage and Loss Umbilical Cord Stem Cells Used to Transport Anti-Cancer Drugs Directly to Tumors Dr. Michael Sacks Named Fellow in the American Society of Mechanical Engineers Dr. Rubin Announces IFATS New Web Site Inflammation Triggers Cell Fusions That Could Protect Neurons, Research Shows Clumps of Red and White Blood Cells May Contribute to Sickle Cell Disease Bioartificial Kidney Improves Survival of Patients with Acute Renal Failure More Kid-Sized Medical Devices Needed Mature B Cells Reprogrammed to Stem Cell-Like State Ovarian Cancer Stem Cells Identified, Characterized New Technique Yields More Detailed Picture of Chromatin Structure Gene Therapy for Addiction: Flooding Brain With 'Pleasure Chemical' Receptors Works on Cocaine, as on Alcohol Study Reveals Why Cancer Cells Like Sugar In Blood Vessel Stents, Innovative Materials Allow Better Control, Delivery of Gene Therapy California Stem Cell Agency Exaggerated Its Role in Funding Key Research Dr. William Wagner Named Fellow in Biomaterials Science and Engineering Digitizing and Revolutionizing Disease Detection Trial: Innovative Approach to Reverse Type I Diabetes University Research Technology Transfer: A Case Study Presentation Study: Genes Involved with Alcohol Metabolism Associated with Increased Risk for Breast Cancer Stem Cell Marker Controls Two Key Cancer Pathways Report: Biocompatible Materials Market to Reach Close to $45 Billion by 2012 Nano-Sized Technology Has Super-Sized Effect on Tumors Nanomaterial Stops Bleeding Nanoimpellers Zap Cancer Cells From Within Drug-Treated Blood Stem Cells May Repair Heart Discovery of Differences in Heart's Precursor Cells May Advance Treatment Options Bone Cells Colonize Glass Scaffolding Blood Vessels: The Pied Piper for Growing Nerve Cells Handbook Update: Fewer Stigmas Associated With Psychiatric Disorders Planned Congratulations, Dr. Kreutzer! Worlds Smallest Heart Pump Under Study Upcoming Clinical Trials to Help Validate Theory Behind Alzheimers Disease Door-to-Balloon Time < 90 Minutes Benefits Heart Attack Patients New Models for Genetic Disease Research on Their Way Study: Community-Acquired Pneumonia Harder on Men than Women Uterine Stem Cells Create New Neurons That Can Curb Parkinsons Disease UC Berkeley and Stanford University Launch Joint Stem Cell Research Institute Study Shows Blood Stem Cells Originate, Are Nurtured in the Placenta Stem Cells from Hair Follicles May Help "Grow" New Blood Vessels Scientists Using Laser Light To Detect Potential Diseases Via Breath Safe and Effective Methods to Perform RNA Interference Developed Researchers Control Growth Rate of Replacement Blood Vessels, Tissues Texas Tech Researchers Discover Two Proteins That Regulate Potassium in Stem Cells Protein Folding Becomes Internet Game to Help Make Medical Discoveries Penn Researchers Engineer First System of Human Nerve-Cell Tissue New Stem Cell Technique Improves Genetic Alteration New Pediatric Research Center New Discovery Shows Gene Therapies Could Have Harmful Side Effects MRI Images of Genes in Action in the Living Brain Captured for First Time Medical Devices/Tools Focus of Student Design Projects Long-Term Muscle Improvements Shown in Gene Therapy Study in Mice Key Factor in Brain Development Revealed, Offers Insight Into Disorder Injection of Human Umbilical Cord Blood Helps Aging Brain Identifying the Genes That Put the "Stem" in Cell Gene Therapy Could Save Kids From a Lifetime of Eating Cornstarch Gene-Sequencing Machine to Boost Personalized Medicine Fat-Derived Stem Cells Could Aid Percutaneous Spine Therapies Deadly Genetic Disease Prevented Before Birth in Zebrafish Umbilical Cord Blood Cell Therapy Reduces Pathology in Animal Model of Alzheimers Disease Clinical Trial Results Look Promising for Tiny Blood Pump Biologic Allograft Material May Repair Torn Rotator Cuffs Amazing Recovery Attributed to Cord Blood Newly Funded BRCA Cancer Research Program Announced Congratulations, Dr. Little! Refocusing Fat: Cosmetic Surgerys Regenerative Medicine Approach NIH Grant to Advance New Brain Tumor Therapies from Lab to Clinical Trials Received McGowan Institute Faculty Members Named 2008 Top-Ranked Physicians PTEI Supports Regenerative Medicine Education and National DNA Day Hillman Center for Pediatric Transplantation: Helping Hundreds Gene Therapy Trains Immune System to Destroy Brain Cancer Cells And Reverses Behavioral Deficits Immune Response Dramatically Boosted With Engineered Artificial Cells Stem Cell Trials Offer Hope for Patients With Severe Ischemic Heart Disease Study Uncovers Way to Fight Leukemia Tumor Killing Virus Selectively Targets Diseased Brain Cells Researchers Identify Cell Process that Regulates Wound Healing California Snags Another Half Billion for Stem Cell Labs Adult Stem Cell Changes Underlie Rare Genetic Disease Associated With Accelerated Aging A Prosthesis for Balance Discovery Could Lead to Urine Test to Detect Cancer Early, Better Prevention Discovering Novel Pathogens New Way to Block Destructive Rush of Immune Cells Found A Window Into Alzheimer's Vet Medicine Researcher Examines Link Between Cancer and Down Syndrome Transparent Adult Zebra Fish Will Make Human Biology Even Clearer Company Seeks Approval for Wireless Medical Device Researchers Use Embryonic Stem Cells to Develop Functioning Immune System Blood Cells Squid Mouths May Improve Artificial Limbs Adult Stem Cells May Treat Many Diseases New Gene Therapy Treatment Shows Promise for Managing HIV Research on Gene and Radiation Therapy for Prostate Cancer Expands, Clinical Trials Starting Self-Assembled Materials Form Mini Stem Cell Lab Adaptable Polymer Inspired by Sea Cucumbers Human Stem Cells Aid Stroke Recovery in Rats JDRF Partners with Plureon to Explore Generating Insulin-Producing Cells from Adult Stem Cells UW Student Attempts to Regrow Human Fingers Transplanted Cells Can Cure Hemophilia RPE Therapy for the Treatment of Retinal Degenerative Disease New Human Performance Research Laboratory Opened World Voice Day Celebrated New Mattress Prevents and Treats Pressure Ulcers Targeting Astrocytes Slows Disease Progression in Lou Gehrig's Disease Funding Boost Received for Pediatric VAD Research Tissue-Engineered Heart Valves: A Regenerative Medicine Approach Pancreatic Cancer Research Science Takes Aim at Battlefield Injury in Massive Project Grant New Stem Cell Source Pittsburgh Compound-B Provides a Definitive Diagnosis of Alzheimers Disease in Living Patients Congratulations, Dr. Cheng! Blue Distinction Centers for Complex and Rare Cancers Named Dr. Stephen Badylak Named 2008 Inventor of the Year! Dr. Herberman Accepts Prestigious Leukemia and Lymphoma Society Award International Summit Held on New Method of Knee Ligament Surgery Ebola Virus Disarmed By Excising a Single Gene Embryos Discarded During IVF Create Stem Cell Lines Engineers Use Blood's Hydrodynamics to Manipulate Stem, Cancer Cells Protein That Controls Hair Growth Also Keeps Stem Cells Slumbering Stem Cells May Gradually Replace Anti-Rejection Drugs for Kidney Transplant Patients First Study of IBD Treatment Through Oral Gene Therapy Receives Funding Genes Protecting Against Parkinson's Identified Genes With Natural-Killer Cell Connections Found in Children With Autism Pathway to Turn Off Immune System Cells Discovered Regenerative Medicine Study: Gene Therapy Shows Promise for Treating Chronic Pain Sales of Stem Cell Products Expected to Reach $87 Million in 2008, Leading Medical Industry Analyst Says Dr. Ermentrout Recognized With Pitt Chancellors Distinguished Research Award! Research May Lead to New Treatments for Resistant Melanoma Genes Linked to Lupus Found Cox Maze Procedure Corrects Atrial Fibrillation FDA Approval Enables Commercial Launch of AbioCor in the United States ACL Repairs in ChildrenA New Dilemma Duchenne Muscular Dystrophy Mice Regenerate Muscle From Stem Cells Annual Boxing Event Raises Funds for the UPMC Cardiovascular Institute Controlling Cell Functions With a Magnetic Field New Program Announced: Master of Science in Health and Rehabilitation Science, With a Concentration in Prosthetics and Orthotics Combination Drug-Device Product Receives FDA Clearance Acute Respiratory Distress Syndrome: How Much Pressure Should Be Applied? Drs. Badylak and Sacks Recognized With Pitt Chancellors Distinguished Research Award! Congratulations, Drs. Badylak and Wagner! A Valentine Story Why Choose Allograft? Update on Work on Artificial Lung Prototypes Radical Cooling May Save Trauma Victims Regenerative Medicine Paper Makes Top 10 of Gene Therapy Downloads Regenerative Medicine Medical Device Study: Drug-Coated vs. Bare Metal Heart Stents Study Findings: Addiction Relapse After Transplantation is Low ID of Key Protein Target May Help in the Treatment of Pediatric Pneumonia Collaborative Effort to Cure Spinal Cord Injuries Announced Steering Stem Cells to Where They Are Needed Growing Miracles: McGowan Institute for Regenerative Medicine Featured on CBS Evening News Regenerative Medicine Phase I Clinical Trials to Begin in Second Half of 2008 for the Treatment of Limb Ischemia Regenerative Medicine: Freeze-Dried Tendon Implants Regenerative Medicine Therapy for Fido Review of U.S. Medical Device Regulation Protein Discovered That May Aid the Spread of Pancreatic Cancer Cells NY Empire State Stem Cell Board Awards $14.5 Million in Funding Magnetically Guided Nanoparticles May Deliver Treatments to Human Organs Keratin May Speed Up Nerve Regeneration and Improve Nerve Function International Team Identifies 480 Genes That Control Human Cell Division Improper Cell Growth Shown to Cause Brain-Specific Stem Cells to Become Brain Tumors Genomic Disorder May Be Associated With Autism Embryonic Stem Cell Lines Developed Without Harming the Embryo Badylak Labs Work Serves as Foundation for Recent Regenerative Medicine Milestone Dr. Fu Recognized by Chilean Society of Orthopaedics and Traumatology Benefits of Initial Temporary Fixation of Femoral Shaft Fractures in Trauma Patients Reported New Institute for Regenerative Medicine in Pennsylvania Regenerative Medicine: Engineered Blood Vessels RNA Interference Heals a Genetic Disorder in a Mouse Via a Regenerative Medicine Therapy Approach Cord Blood Stem Cell More Utilitarian Than Embryonic and Adult-Source Stem Cells Alternate Nerve Pathways Help Patients With Spinal Cord Injuries Walk Again DOD Contracts for Stem Cell Therapy The Effectiveness of Magnetic Therapy Confirmed Tumor Vaccine Hopes to Unprotect Cancer Tumor Cells Polymer with Neurotransmitter Promotes Nerve Growth Harvard Researchers Convert Skin Cells to Induced Pluripotent Stem Cells (iPS) Advancements in Detecting and Diagnosing Biliary Atresia in Children May Improve Outcomes Regenerative Medicine: Lab-Grown Organs Caregivers Struggle With the Effects of Alzheimers Cancer Screening Tool: "Swish-and-Spit" Test Regenerative Medicine Therapy Trial in Patients with Advanced Skin Cancer Shape-Memory Polymers For Use in Medical Applications Tracking Transplanted or Implanted Stem Cells Genetic Engineering Corrects Mental Retardation and Autism in Mice DataChip and MetaChip Could Eliminate Animal Testing New Stem Cell Line Avoids Negative Immune Reaction Regenerative Medicine Tool: Stem Cell Sorter Regenerative Medicine Therapy for Heart Patients Regenerative Medicine: Rebuilding Our Bodies Regenerative Medicine Discovery: Stem Cells Predict Disease, Drug Toxicity Prison Time for Two Women Who Deceived ALS Patients and Their Families Regenerative Medicine News: Device May Monitor/Guide Cancer Treatment Ads for Medical Devices, Implants Should Carry Warnings of Dangerous Side Effects, Infections Unrelated Cord Blood Transplants Assist Rare Pediatric Disorders Related Donor Unnecessary for Blood Cancer Stem Cell Transplants Per Regenerative Medicine Study New Gene Transferred to Cancer Patients Via Regenerative Medicine Therapy Human Blood Cell Found Through Regenerative Medicine Work at Stanford Regenerative Medicine Therapy Used for Sickle-Cell Anemia in Mouse Model Measuring Electric Fields Deep Inside a Cell With a New Regenerative Medicine Tool Clinical Study of Regenerative Medicine Gene Transfer Approach to Treat Epilepsy Receives Funding Federal Workshop Focuses on Development of Regenerative Medicine Medical Products Orthopaedic Surgeon Recognized with Elite Award Induced Hypothermia May Help Traumatic Brain Injuries in Children McGowan Institute Faculty Member Dr. Ronald Herberman Accepts C-Change Exemplary Implementation Award Nanotechnology to Address Infections Associated with Ventricular Assist Devices (VADs) Regenerative Medicine Could Support Our Troops Regenerative Medicine Trials: Nerve Stem Cell Products Blood Stem Cells Are a Regenerative Medicine Defense Mechanism Study Highlights the Regenerative Medicine Capabilities of Neuronal Stem Cells New Therapy Uses Regenerative Medicine Tools to Help Heal Heart Regenerative Medicine Stem Cell Treatment for Osteoarthritis New Regenerative Medicine Hope to Restore Painful, Degenerate Discs in the Spine Seaweed Transformed Into Regenerative Medicine Stem Cell Technology Regenerative Medicine Treatment: Stem Cells Can Improve Memory After Brain Injury U of M Performs First Systemic Therapy for Fatal Childhood Disease Resetting A Molecular Switch May Help Save Preemies Regenerative Medicine Across the Atlantic Blood-Incompatible Baby Heart Transplant Seen Safe New for Regenerative Medicine: Brown Scientists Take the Petri Dish to New Dimensions Regenerative Medicine Researcher Receives Innovation Development Award Successful Use Of Cloning To Produce Monkey Embryos Gene Therapy for Leber Congenital Amaurosis Type 2 Blindness Halted Gene Therapy Study to Resume Adult Stem Cell Transplant May Help Those With Autoimmune or Genetic Blood Diseases Regenerative Medicine Medical Devices Support Pediatric Cardiothoracic Success Story Regenerative Medicine Trial Helps Patients With Diabetes Brain-Controlled Medical Device Drug Decreases Neurological Regenerative Medicine Effects in ALS Patients Award Winning Greening Efforts at Childrens Hospital Dr. Rubins Regenerative Medicine Efforts Receive Presidential Early Career Award for Science and Engineering Gene Therapy Treatments to Help Prevent Fatal Arrhythmias Children's Hospital Receives $23 Million Gift Badylak Lab Featured in Esquire Magazine Congratulations, Rory Cooper and Pitts Department of Rehabilitation Science & Technology! Regenerative Medicine Gets Engineering Model Help to Determine Best Timing for Liver Transplant Regenerative Medicine: Pediatric Ventricular Assist Device Artificial Lungs as a Regenerative Medicine Tool $4.75 Million Grant for Spinal Cord Injury Rehab Gamma Knife Surgery New Cameras Measure Joint Problems in Pediatric Arthritis Patients Senator Arlen Specter Supports Regenerative Medicine Earlier Diagnosis of Alzheimers Disease Quality of Life Technology Engineering Research Center Dr. Lee Heads Regenerative Medicine Study Pediatric Double Transplant Virus Destroys Brain Tumor Stem Cells Probe Lights Up Tumor Cells Medical Complications Associated with Hematopoietic Stem Cell Transplants Cartilage Grown from Embryonic Stem Cells Pioneering Cell Therapy for Leukemia Patients Biodegradable Polymer Replaces Virus to Deliver Gene Therapy Promising New Treatments for Tendon Injury and Disease Engineered Heart Muscle Cells May Repair Damaged Organs and Test New Drugs Embryonic Stem Cell Research Receives Federal Funding Stem Cells Potential Therapy for Heart Attack and Muscular Dystrophy Gene Therapy for Angina in Women Tissue Engineering Patent Awarded Stem Cells Help Mans Best Friend Fat Negatively Affects Pancreas Cell Transplants Bioengineered Skin Grafts Worlds First Robotic Ankle Stem Cells: An Unfair Advantage to Athletes? Asthmatics Breathing Easier Created Cancer Stem Cells Could Aid Cancer Research Mini Implanted Devices May Treat Epilepsy, Glaucoma Weighing In on the Half-Liver Transplant Study of Sepsis: Clues to Its Cause and Progression Electrical Implant Steadies Balance Disorder in Animals Novel Surgical Adhesive Awarded US Patent Tissue Engineering Research Focuses on Vocal Cords Deep Brain Stimulation Helps Brain-Injured Man Treating Major Depression and Congestive Heart Failure Simultaneously Black Raspberries as Treatment for Cancer? Decreasing Door-to-Balloon Time New Gene Therapy Tools for Inherited Blindness Domino Liver Transplant Involving a Pediatric Patient Development of Pediatric Artificial Heart ACL Repair Antibodies Significantly Reduce Liver Cancer Tumor Cell Production and Survival Translating Fat Into New Medical Treatments Cord Blood Used to Treat Early Diagnosed Type I Diabetes Managing Trauma and Cancer Through Diet Cavities a Thing of the Past? PTEI Partnership Provides Women with Biotechnology Career Opportunity Single Cell Technology: An Answer to Stem Cell Concerns? Gene Therapy Helps Those With Parkinsons Biodegradable Gel Helps Heal Arteries Increasing Blood Stem Cells Through Zebrafish Experiments A Bead-Time Story Sounds Like Gene Therapy May Help Hearing Loss Off-the-Shelf Vascular Grafts Fat Tissue Alternate Source for Blood-Forming Stem Cells Effective Chemotherapy Must Target Cancer Stem Cells, Spare Normal Stem Cells Aging Stem Cells and Diseases of the Aged A Little Monkey Business Embryonic Without the Embryonic Transforming Early Diagnosis of Alzheimers Monkeys With Parkinsons Improve Following Neural Stem Cell Treatment Next Generation Wound Therapy Medical Devices Receive FDA Clearance All in a Weeks Work Rats With Ischemic Spastic Paraplegia Walk After Human Stem Cell Treatment Elderly With Depression May Benefit from Second Medication Gene Therapy Helps Chronic Pain Management Of Hearts and Veins Traumatic Brain Injury A Potential New Treatment for Impotence Gene Therapy Reverses Heart Failure in Animals Patients Own Blood Platelets Help Heal Wounds The Healing Properties of Fat New Heart Support Device Trial Underway Botox Benefits Prostate Gene Therapy for Osteoarthritis Sufferers Engineered Stem Cells from Umbilical Cord Blood Produce Insulin Mechanical Heart Pump Aids Failing Hearts Bridges to Heart Transplantation Replacing Bone Mass A Noninvasive Treatment for Urinary Incontinence Student Design Project Improves Cell Therapy Administration Cell Banking Universities Provide Rehabilitative Support for U.S. Soldiers Stem Cells May Help With Genetic Corneal Diseases Bald No More? Cardiac Care Stem Cells Help With ALS Answers From Idea to Reality One Step at a Time Organ Tissue Engineering Cancer Research Results Communicated Tissue Engineering Education Gets a Boost Engineered, Temporary Tissues Printed Tissues Cell Gender Matters Spotlight: The Berlin Heart and FDA Approval More Efficient Artificial Lungs Of Sights and Sounds ALS Research at Pitt A Heartfelt Miracle Defense-Related Research: Helping Todays Soldiers A Revolution in Heart Transplantation Technology Wall Street Journal Highlights McGowan Institute Tissue Engineering Tissue-Engineered Heart Valves Research Suggests Optimistic Future for Diabetes Patients Adult Stem Cells to Repair Hearts Salamanders and Newts Do It, So Why Not Us? Doctors Grow Organs From Patients' Own Cells A Transplant to Repair Urinary Incontinence? Craniofacial Tissue Engineering by Stem Cells Peptide Common to Both Forms of ALS Tissue-Engineered Bladder Begins Phase 2 Clinical Trial Shaking Improves Development of Embryonic Stem Cells© McGowan Institute for Regenerative Medicine | Contact Us